The Top LNG Export Projects in Canada

0

Canadian natural gas producers are hoping to spend a minimum $20 billion on shipping Liquid Natural Gas (LNG) to Asia in the next 2-9 years. The size of the prize is huge—spot natural gas in Japan can be as high as $17/mcf—more than 10x Canada’s spot price of $1.50 now.  But competition is fierce from Australia, Qatar, and United States…as I wrote about here.

And those prices could be going higher. Asian demand for LNG is expected to increase 45% from the 20 bcf/d (billion cubic feet per day) now to 29.1 bcf/d by 2016—just four years from now.

In this article I’ll outline:
a.     who the Canadian players are
b.     the estimated size and cost of their projects, and tentative timelines
c.     some simple economics
d.     and what has to happen still for shipments to actually start

Shipping LNG to Asia is not just a great opportunity for Canadian producers, it’s a necessity. US gas production is expected to stay strong—and prices low—for years.  In 2008, the U.S. imported 13% of its total natural gas supply–almost all of it from Canada–but the U.S. Energy Information Administration (EIA) estimates that by 2035 that figure will be lower than 1%. And this shift is already happening.

Now, if all of these projects had been fully operational in 2010, Canada would have been the second-largest LNG exporter in the world, behind only Qatar.  Each of these facilities is now forecast to be built in the small town of Kitimat B.C., located at the end of a long narrow (protected) ocean water inlet… where Alcan has had a large aluminum facility for decades.

Here are the three most advanced LNG export projects in Canada:

KM LNG Operating General Partnership

Who:
Apache Corp. (APA-NYSE)           40%
Encana Inc.  (ECA-NYSE; TSX)   30%
EOG Resources (EOG-NYSE)       30%
Capacity:                                        1.4 bcf/d (11.66 million tons annually)
Projected cost of facility:              $10 billion (but $5.6 billion if only do 0.7 bcf/d)
Approved?                                     Yes—20-year license
Projected completion date:           Late 2015

This group—all upstream producers—is also the only one to have approval for a pipeline to transport the gas from the field to the LNG facility—the Pacific Trails Pipeline. Despite the approvals, the partners haven’t made the final decision to build the project.

What’s left to bring the project together? Money and customers. They’re still looking for money, which should come from, potentially, the pipeline company, but certainly from an anchor customer in Asia who would come in for 20% equity on the project AND the upstream resources; the gas itself.  Everybody would reduce their interest pro-rata in that case.

The Globe and Mail reports that the project has two deals already signed with Japanese power producers, and other potential customers are lined up.

But analyst Gerry Goobie with Purvin & Gertz Inc. told the Calgary Herald that the fact that the partnership is looking for equity shows that it still needs to secure long-term customers.

“The bottom line is they’re still trying to strike a deal,” he said. “The assumption is the deal that they have will be sufficient to cover off all the capital costs that they are going to spend to build this thing and give them a reasonable return.”

BC LNG CO-OPERATIVE

Who:        13-member group (includes LNG Partners LLC of Houston and the Haisla First Nation)
Capacity:                                     0.22 bcf/d (1.8 million tons annually)
Projected cost of facility:           $360 million – $450 million
Projected completion date:        2014
Approved?                                   Yes—20-year license

This proposal has the earliest (tentative) start date—early 2014. This is by far the smallest of the three proposals, and would be unique in that they will be located on a barge 7 km south of Kitimat, and grounded on the shore.

“This thing should be fun to get it off,” Tom Tatham, the managing director of BC LNG (and of LNG Partners LLC of Houston), told Reuters. “There’s really nothing that’s ever been done like this in the LNG industry.”

The project is partially intended to allow smaller natural gas producers to ship LNG abroad to more lucrative markets.

Specifically, an operating company at the facility will liquefy a cooperative member’s natural gas for a fee. Companies can buy into the cooperative for $50,000 or can receive membership for free by writing a letter to the National Energy Board stating an intent to buy or sell gas through the terminal (cooperative members can be buyers or sellers).

What’s left to bring the project together?  Pipeline capacity.  It only makes sense for them to use Pacific Trails (I think it would be politically difficult for Apache et al to not allow small producers access, including those with First Nations ties, for a toll fee), but it may not be ready by then.

Shell

Who:                           Royal Dutch Shell   40%
Mitsubishi                    20%
Kogas                           20%
CNPC                           20% (China Nat’l Petroleum Corp)
Capacity:                                     1.44 bcf/d (12 million tons annually)
Projected cost of facility:           $12.35 billion
Projected completion date:        2020
Approved?                                   Pending

What’s left to bring the project together? Approvals, pipeline capacity and pipeline approvals.  All the players together in that consortium have lots of financial ability.

The project could come online at the end of the decade and might be able to send as much as 2 bcf/d abroad per year. Shell has a lot of experience in LNG, operating 2.4 bcf/d export capacity in other areas of the world, and another 2.9 bcf/d coming into production by the end of 2015.

Shell first announced its plan for the venture last fall, shortly after it (and some of its partners) purchased the Methanex marine facility in Kitimat, which is no longer in use.

That’s the Tier 1 list of Canadian LNG exporters.  Other groups looking include:

Petronas-Progress (PRQ-TSX)

Petronas is a large Malaysian oil and gas company with This 80/20 partnership aims to build a 1.0-1.2 bcf/d LNG plant in B.C., bringing the first 0.5 bcf/d online in 2017-2018 and the rest a year later.  A feasibility study on the project should be complete by the end of Q3 2012.

INPEX-NEXEN (NXY-NYSE; TSX)

Inpex is a large Japanese oil and gas producer.  In November 2011 they joint ventured 40% of Nexen’s holding in the Horn River, Cordova and Liard basins, all in B.C.  There is little doubt they will be going after an LNG license. Do they do it on their own or join one of the three more advanced projects?

Potential issues with Canadian LNG projects

There are still potential speed bumps for Canadian LNG exports.  These pipelines need to get built, which means passing through areas that have attracted so much opposition to the Northern Gateway oil pipeline.

Where will all the electricity and power that’s needed come from, and what infrastructure is required for that?

The economics of Canadian LNG exports to Asia should be similar to those of Australia, says Canadian brokerage firm CIBC Wood Gundy in a report earlier this year.

Japan is the largest LNG market, and the shipping route from Canada to there is 4300 km, vs 3100-4300 km for Australian projects.  They add that Japan will want to have several sources of LNG.

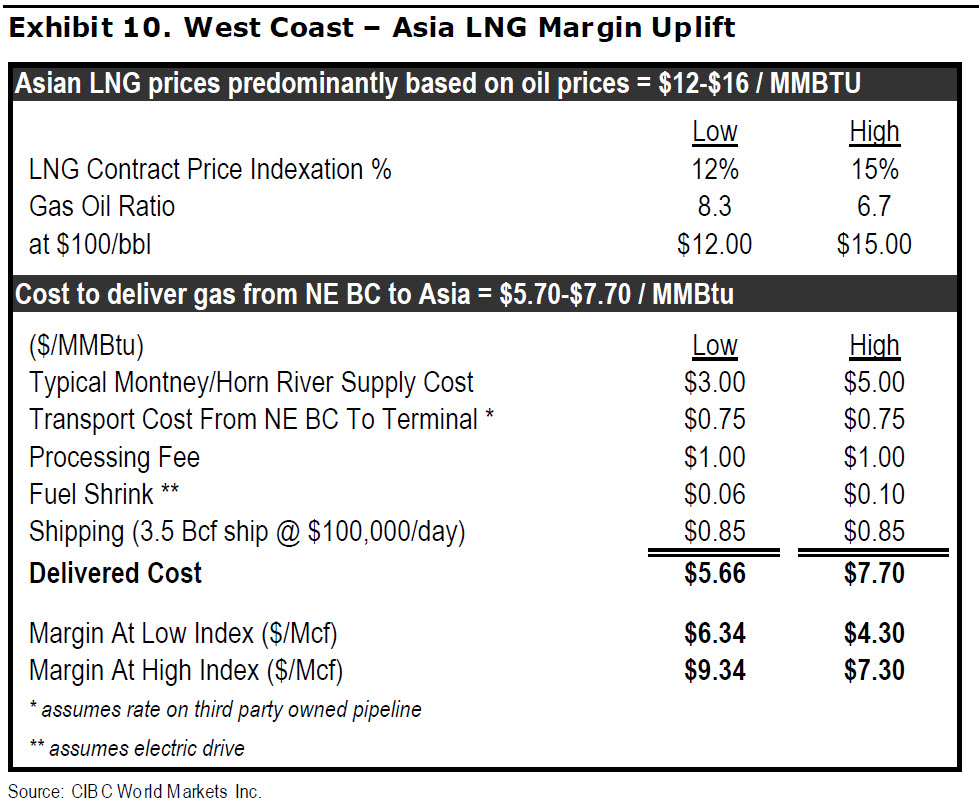
Long-term LNG contracts are usually priced at 12-15% of Brent crude, which at $100 Brent means US$12-$15/mcf—still 8-10x Canadian spot prices.  CIBC is forecasting Canadian LNG exports can earn a 17% internal rate of return at $4/mcf gas.  That would be higher at today’s low gas prices.

They broke down how the costs of getting the gas from the field to a Kitimat LNG facility, liquefying it, and shipping it to market would cost:
West coast lng
So you can see a 50% gross margin here, under their pro forma model.  If cost inflation doesn’t escalate out of control, and Asian demand meets expectations, then the size of the LNG will make a very healthy return for Canadian exporters.

The top LNG exporters are Qatar, representing nearly 25 percent of global LNG exports with 7.3 bcf/d.  Then there’s Indonesia (23.7 million tons, 3.03 bcf/d), Malaysia (23.1 million tons, 2.96 bcf/d), Australia (19.1 million tons, 2.45 bcf/d), Algeria (18.7 million tons, 2.39 bcf/d), Nigeria (18 million tons, 2.31 bcf/d) and Trinidad and Tobago (15.4 million tons, 1.97 bcf/d).

Note how Canada – the world’s third-leading natural gas producer – is nowhere to be found on this list. However, that could soon change with the three projects in Kitimat.

by +Keith Schaefer

My Top Junior Oil Stock in the Permian Basin “Tight” Oil Play

0

Part 2: The Permian Basin – Cline Shale Resource Play

In Part 1, I explained how the Permian Basin in Texas was exploding with industry and investor interest—because of all the new tight oil plays being discovered and developed.

And that has me excited about the prospects for one Canadian junior—though all this excitement is happening a year later than I thought it would.

But at the end of the day, and the end of the play, all this should all be good news for one of my OGIB portfolio stocks, Lynden Energy (LVL-TSXv).

Lynden has 6500 net acres in the Wolfberry trend in the main Permian Basin, and is producing just over 500 bopd from that land base.  When I bought it a year ago, I thought the value of other Wolfberry transactions made the stock worth $0.90/share alone.  I still believe that—but it was really their Mitchell Ranch property on the eastern shelf of the Permian that I saw as the catalyst to make the stock a double or a triple.  And it’s two formations that could give the stock a chance – the Cline Shale and the deeper Mississippian.

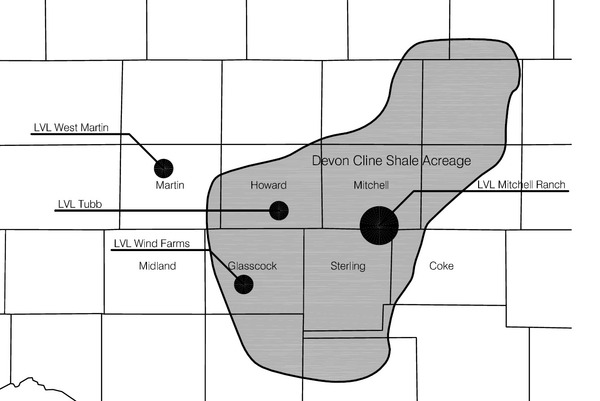
Devon Energy’s map of where the Cline shale is pervasive has Lynden’s Mitchell Ranch very close to the middle of play.  That is clearly getting some market attention in the last week.

As background, I bought 67,000 shares of this stock a year ago at 66 cents, thinking the world was about to discover the eastern shelf of the Permian and both the play and Lynden’s stock was about to take off.

Well, I sure timed that wrong as the stock has spent the last year well below my purchase price.   But now, a full year later, market interest has arrived, based on newfound enthusiasm for a large resource play in the Cline/Lower Wolfcamp.

Here’s a map by Lynden of where their property sits:

Permian Basin Lynden Cline Shale Map-2

Lynden is drilling 31 gross Wolfberry wells this year, where success rates are high and they are steadily adding production.  They are producing just over 500 bopd now, and expect to exit this year at 900-1200 bopd. Their partner, a private company called CrownQuest LLC, is the operator.

A net minority, non-operated interest could be the reason the stock has languished (other than a rotten market for junior oil stocks), plus the fact that Lynden and CrownQuest LLC have been very conservative in drilling Mitchell Ranch, where the two partners are 50/50.  There are two vertical drill holes into Mitchell Ranch, but only one is producing, and that is from only one zone—the Spade 17 well.

There are only two more (gross) wells in the 2012 budget for Mitchell Ranch, which will be targeting primarily the upper, shallower zones—not the big Cline Shale.  They have drilled through the Cline, but don’t have the resources—or the interest—in going horizontal here.

Lynden is a land play, and management will leave the expensive horizontals for whoever acquires them and partner CrownQuest LLC’s interest in Mitchell Ranch.

Lynden has been able to pull off two big corporate moves this year that got me and the market excited—only to see the stock pull back on no volume after a flurry of interest—which makes me cautious in buying more.

One was bringing Chesapeake (CHK-NYSE) into Mitchell Ranch to joint venture 35,000 acres, one-third of the 103,400 acre Mitchell Ranch play (leaving Lynden with a 50% WI in 68,400 acres, or net 34,200 acres).  Chesapeake is specifically interested in a deeper zone, the Mississippian at 7500 feet, where they have had great success in eastern Oklahoma.  There is no public data on how their first well is going.

But Lynden got Chesapeake to pay enough cash to get in that they were able to pay the underlying land owner their option payment, and Chesapeake shares the data with them.  So Lynden gets a free look at how the upper zones they’re targeting look, and a free learning curve on how to drill the Mississippian on their remaining acreage.
The second was securing a $50 million credit line, so the company didn’t need to raise equity again. But like I said, Lynden is a land play first and my fervent hope is that Chesapeake or some other major or large intermediate will come in and buy Lynden and CrownQuest LLC’s position out.

“There’s always a bull market somewhere.” There is more truth to this than most investors realize. And right now one of the biggest — if not THE biggest — bull markets in the entire Energy Patch is quietly taking shape. I’m referring to the technological revolution in oil & gas — the technologies, for example, that can increase yields by 4 to 7 times… launch huge new “discovery” fields… or even “extend the lives” of older fields. It is exactly these kinds of innovations that are creating triple-digit profit opportunities in the Oil & Gas Investments Bulletin portfolio. To learn more about what’s driving these opportunities in my OGIB personal portfolio — and how it all works, keep reading here.


Lynden’s Mitchell Ranch property has three main plays:

  1. The upper shallow zones at 4200-5200 feet that can produce 75-100 bopd IP rates
  2. The Cline Shale/Lower Wolfcamp that Devon is chasing, with potential 600 boe/d wells
  3. Mississippian formation below that, which Chesapeake is now developing

And there’s another formation, the Ellenburger, beneath the Mississippian that is potentially productive as well.
Let me draw up a hypothetical valuation—with one foot planted firmly in the air.

Valuing these assets at this early stage is very difficult—but because of the size of the asset – 64,000 acres—there is some leverage here with any proof-of-concept from any of these deeper zones at Mitchell Ranch. The market agrees with me because it’s valuing Mitchell Ranch at zero.

But I’m assuming that Devon’s Richel would only farm out 50% of this large resource play for that $1.35 billion, which values the play at $2.7 billion or $5400/acre.

Lynden’s stock trades solely on the Wolfberry assets, and the reason I bought the stock is because I thought those were worth 90 cents a share.

Here are some Wolfberry transactions in the last 12 months:

  • April 28 2011 – Antares Energy paid $62 million for 3,109 acres, or $19,942/acre
  • April 28 2011 – Berry Petroleum paid $123 million for 6,000 acres, or $20,500/acre
  • May 12 2011 – W&T paid $366 million for 21,500 acres, or $17,000/acre
  • June 22 2011 – Laredo paid $1 billion for 65,000 acres or $15,000/acre
  • Dec 6 2011 – Comstock paid $332.7 million for 44,000 acres for $7,561/acre
  • Dec 22 2011 – Concho paid $175 million for 10,200 acres, or $17,157/acre
  • Feb 11 2012 – Energen paid $65.8 million for 3,200 acres, or $20,300/acre

The average value per acre in these seven deals is $16,780.  Lynden has 6310 net acres, all of which are in producing areas (especially with the first producing well on their Tubb property).  That would give Lynden’s Wolfberry assets a value of $105,881,800—with 109 million shares out that’s 97 cents value.

Were life so simple.  There’s 42 million warrants between 50 and 70 cents, taking the outstanding balance to 151 million, but with $27.75 million extra in cash.  (Folks, warrants KILL stock prices. Never a good thing.)

But $105.88 million/151 million=70 cents—20% higher than where the stock roughly is today.

And I haven’t started on Mitchell Ranch yet.  The blue sky here is that if Chesapeake can get economic results out of the Mississippian—and at that depth, I’m guessing all-in costs of $7-$8 million will need at least 500 bopd of oil and whatever NGLs and gas on top of that will be required—then Mitchell Ranch is worth potentially $5,000 an acre, and their net 34,200 acres is worth $171 million, or $1.13—which values the company at $1.83/share.

And that doesn’t take into account the Cline shale potential.  You get the picture—lots of leverage if these plays work out.  And that is the type of company I like to invest in—just usually with a lot less shares out.

It will be interesting to see how the market values Mitchell Ranch in the near term, with all the new excitement in the east shelf of the Permian, just because of its address—and in advance of any word from Chesapeake in the Mississippian (at least 3 months away, IMHO).  Because unless somebody really close by shows some Devon-style production levels from the Cline, its prospectivity will be hard to determine.  It’s highly unlikely Lynden will ever drill an expensive horizontal well in the Cline.  They’ve got their land position and they want to monetize it, not drill it.

On another metric, price per flowing barrel, it’s not unusual to see $150,000, which would put Lynden’s year end 1000 bopd worth an even $1/share.  And while that’s a theoretic value for Lynden as the stock has never traded close to that, increased market awareness could change that.

So my conclusion here is that I expect the market to heat up, but there is no telling how much, and I’m not buying any more stock here—but I’m not selling any now either.

by +Keith Schaefer

The Permian Basin Oil Play: “Unleashed”

0

The Cline Shale in Texas is one of the hottest new shale plays in the USA.  Devon Energy (DVN-NYSE) is suggesting it’s a huge play, pervasive over a very large area on the eastern shelf of the Permian Basin.

In fact, the Permian is bursting with new resource plays—what’s old is not only new again, but pistol hot.

One analyst report last week said several new resource plays in the Permian are being “unleashed,” and that there are so many multiple horizons or formations that are stacked on top of each other in the Permian—that are just now being accessed with horizontal drilling—that it’s like having 10 or 11 EagleFord shales stacked on top of each other.

And interestingly, there is one Canadian listed junior with a large land position close to the middle of Devon’s Cline Shale map.  More on that later.

Source: Devon presentation Apr 2, 2012

Devon got the market’s attention earlier in April when they said they had staked over 500,000 acres and had an unrisked 3.6 billion barrels of oil there.  “Unrisked” is a fairy tale number that could be right if every single well hits their type curve.  Devon President John Richels also said the acreage was worth $1.35 billion from a partner—presumably for 50%.

Devon gave a “type curve” for a Cline Shale well—a guess at how much the well would produce over time—of total production 570,000 barrels of oil equivalent—and 85% of that would be oil and liquid rich gas.  (The industry calls that the EUR—Estimated Ultimate Recovery.)  The well would flow an average 600 boe/d for the first month (that’s called an “IP30”—the Initial Production rate for the first 30 days the well is on production) and cost $6.5 million.

It’s early days in the Cline—Devon’s goals right now are to get more core data, figure out the best way to complete, or frack it (how much pressure, do you use water or oil or propane, what direction do you drill, what chemistry do you use etc.).

“There’s always a bull market somewhere.” There is more truth to this than most investors realize. And right now one of the biggest — if not THE biggest — bull markets in the entire Energy Patch is quietly taking shape. I’m referring to the technological revolution in oil & gas — the technologies, for example, that can increase yields by 4 to 7 times… launch huge new “discovery” fields… or even “extend the lives” of older fields. It is exactly these kinds of innovations that are creating triple-digit profit opportunities in the Oil & Gas Investments Bulletin portfolio. To learn more about what’s driving these opportunities in my OGIB personal portfolio — and how it all works, keep reading here.


But initially, they’re saying the Cline is an organic rich shale, with Total Organic Content (TOC) of 1-8%, with silt and sand beds mixed in.  It’s about 60-150 metres (200-550 feet) thick.  Contrast that to the Bakken where the payzone is often only 10-25 m thick.
It lies in a broad shelf, with minimal relief (that means it lies nice and flat), and it’s in the “oil window” (a depth where the right temperature and pressure allow the ancient organic matter to turn into oil—gas is below oil) and has nice light oil of 38-42 gravity with excellent porosity of 6-12%.  So there are lots of holes in the rock containing oil, but all those holes aren’t well connected, meaning it has low permeability.  That is normal in these tight oil plays.

And there are frack barriers above and below the shale—rock types that are really hard and would likely halt any fracturing beyond the Cline—this is important because it means that water will not likely be able to come into the well (and water supersedes oil in coming back up the well—most of the time it’s a real negative) from other formations.

“We’re very excited about the Cline,” Andy Coolidge, Devon’s vice president for the Permian Basin, said recently. “We expect to deliver highly economic and robust production growth.”

Technically, the Cline Shale—also called the Lower Wolfcamp formation—looks like a great play.  And because it’s in the Permian Basin, services like drilling rigs and fracking spreads are inexpensive and easy to access.

It’s fascinating for me to watch all these new plays get discovered and developed in Texas, particularly the Permian, because I keep thinking—but it has been explored for years…how do they keep finding new stuff?

The reason is mostly the Shale Revolution.

The Permian Basin is already one of the most prolific oil areas in North America, producing 35 billion barrels from multiple zones.  But now there are even more zones, but they’re all “tight oil.” They’re being made productive by companies who can find the time and resources (qualified people and money) to test more expensive and time consuming horizontal wells—which are usually $5-$9 million now—and quietly assemble a land position without bidding up prices.

Horizontal technology and hydraulic fracturing are old news now, in one sense, but the oil and gas industry is conservative and prior to 2008 it was mostly early adopters in the industry that used it.  Only since 2009, after oil prices moved back up sharply, did horizontal technology become truly mainstream.

All the new productive zones—what the industry calls “stacked pay”; payzones (or productive oil formations) that are stacked on top of each other—can now make a well extremely profitable, as it can often produce from several formations over time.  This chart from Devon’s April 2 presentation shows as many as 15 productive zones:

The Cline is actually the “source rock,” the bottom layer of the Wolfcamp formation, which has been drilled with great success vertically for years.  But like other formations, exploration slowly moves out from a core area.

The Wolfcamp was originally thought to be 20 miles wide and 60 miles long, but now it’s 40×100 miles… and exploration continues.

This should all be good news for a fast-growing junior producer with a big land position, the details of which I will share with you in my next Free Alert.

by +Keith Schaefer

What the “Real” Oil:Gas Ratio Is Saying about Natural Gas Stocks

0

Intermediate natural gas weighted stocks in Canada are valued higher—sometimes a LOT higher—than oil stocks, despite oil being worth 35 times more than gas.

And that could mean significant price weakness for already battered natural gas stocks, says Haywood Securities analyst Alan Knowles.

“People think (the stocks of) gas companies have corrected, but they’ve only partially corrected,” he told me in a phone interview.  “The correction hasn’t kept pace with how far it should have gone,” given how low natural gas prices have moved.

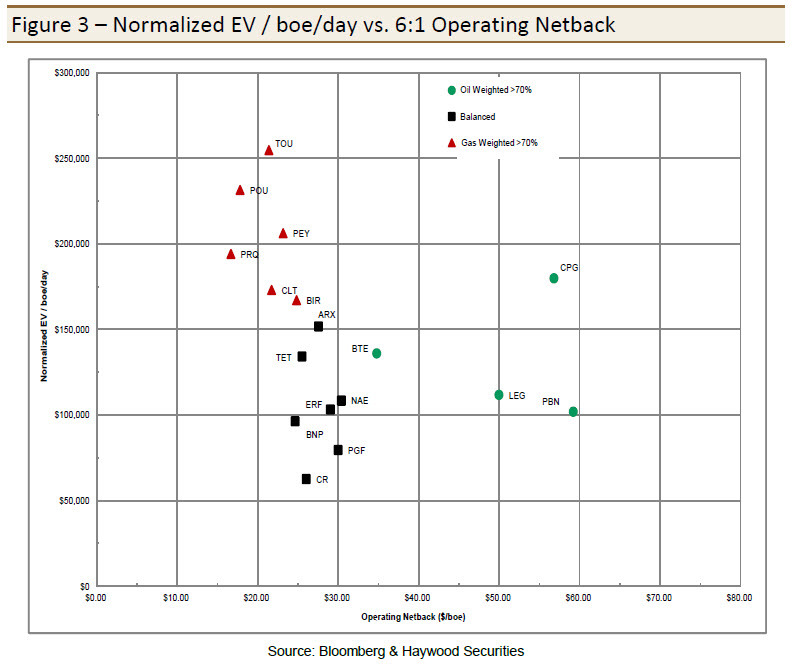
At first glance, Knowles’ says the gas companies are NOT valued more highly than the oils—but that’s comparing the two groups at the industry standard of 6:1; where 6 barrels of natural gas are considered equal to one barrel of oil.  See his chart below that shows this.  The green dots are the leading intermediate oil producers—Crescent Point, Legacy Oil and Gas, Baytex and Petrobakken, and the red triangles are the gas weighted companies.

The gas stocks are clearly cheaper on this chart, which measures them in terms of the value of their production — $50,000 per flowing barrel up to $250,000; again all based on the industry standard 6:1 ratio.

So this is how you would read the above chart…

Look at the red triangle symbol TOU, Tourmaline Energy, a heavily weighted gas producer. This chart shows they make just over $20/barrel profit, and for that they are valued at roughly $70,000 per flowing barrel of production.

Crescent Point (CPG), which is Canada’s leading intermediate oil and arguably the most successful and most respected management team in their sector, generates a profit per barrel of over $55… and the market values them at roughly $160,000 per flowing barrel.

But the big problem is that the value of gas is, on average, 35x less than oil—so Tourmaline and all these other gas producers should have their daily production levels divided by 35 to get an accurate comparison to oil producers, not 6.    And that creates a HUGE valuation gap for these stocks to contend with.

Knowles went through each producer under coverage to get a customized oil:gas ratio based on cash flow generated for each commodity—and the ratios for the gas stocks ranged from 29.9 – 41.5.  When you compare the valuations of all the companies on their true cash generating ratio of gas to oil, this is what the chart looks like:

figure operating netback

Look where Tourmaline is now—at the top!

“Why should a gas company get so much more value than oil-weighted value?” asks Knowles.  “Almost all the gas guys are valued higher than CPG, and does that make sense?”

This chart shows that the 6:1 ratio of oil to gas is outdated. In fact, most people in the industry have been saying that for years.

“We have to rethink the 6:1 ratio,” says Knowles. “Two 50,000 barrel-a-day companies are not the same.  If one is half natural gas, all of a sudden they’re a 25,000 bopd company, from a revenue point of view.”

Knowles says his chart should be a warning to investors bottom fishing for natural gas stocks now.

“This is kind of a warning.  Gas prices were down 33% in Q1 and they’re down even more now.”  He says investors will finally understand how bad things are getting when natural gas companies start reporting their quarterly financials.

“It takes hard reality of financial results before it really hits home for a lot of people.  When we see it in black and white it will get crystallized—there will be some companies whose cash flow is devastated—especially on the juniors, they’ll be hard hit.”

He expects a lot of Canadian natural gas producers just won’t re-start production after this year’s spring break-up—the 4-6 week stretch where big trucks are banned from the thawing roads in western Canada.

Knowles is quick to point out valuations aren’t just in the numbers.  There are a lot of intangibles, like the Street’s opinion of management—that counts for a lot.

Take my example of Tourmaline.  Chairman and CEO Mike Rose is a legend, successfully selling Duvernay Oil and Gas to Shell for $5.6 billion in 2008. Few CEOs have as good a track record.  And that’s a big part of that stock’s valuation.

Later this year, Knowles sees the oil:gas ratio increasing to over 40 as Canadian oil prices increase.  He says that the reversal of the Seaway pipeline in the US—which will now take oil from Cushing OK instead of delivering it, will help Canadian gas prices.  Refinery turnarounds will also be a plus.

He sums up: “We think people have not adjusted to the reality of gas stocks.  They’re still looking at it as 6:1.”

by +Keith Schaefer

Sell in May and Go Away?

0

2011 was a textbook year for the old saying “Sell in May and Go Away.”  But market action in 2012 is saying strongly that would be the wrong tack for investors, says Donald Dony, author of the monthly Technical Speculator newsletter.

“This year the market has been reacting on any kind of pullback with great strength,” he said in a phone interview from his Victoria, B.C. home.

“Just the way the market is performing, the way the buying it comes in on the dips, and the VIX being so low…this probability points to a strong mid-year market, or at least a flat mid-year market; but not a correction.” 

“In early March 2012 I thought we were in for a big one (correction), but then the world markets came in and whoosh, it stopped.  That seems to be a different behaviour than what we saw in last couple of years.  There were real pullbacks in 2010 and 2011.”

Dony qualifies that everything is based on probabilities, but they’re pointing in that direction.  Other factors making him bullish past May are the large amount of money he sees sitting on sidelines, and numbers out of the US showing the economy is improving—rising GDP, falling unemployment.

“We may just have sideways action. Many times in the last 10 years the market did peak out in May, just hung there but then shot up in August-September.  That happened in 2003, 2005, 2006, and 2009.

Dony says that overall in the last 10 years, to “Sell in May and Go Away” and buy again in November, you would have been right 4 times, and wrong 6 times.  In 2003, 2005, 2006, 2009 and 2010, the “Sell in May…” strategy did not work as well as holding throughout the year.  In 2004, 2007, 2008 and, 2011 the “Sell in May..” worked.  This was the right approach.

In fact, Dony says 2012 could be the biggest year for stocks since 2007—he’s telling his clients to stay fully invested right now, even through this April downturn, which he saw coming.

First off, there’s the “January Effect”. Dony says there has been 13 Januarys since 1970 that the S&P 500 finished 3.75% higher than where it started—and every time it’s higher at year end.  And since 1940, 24 years out of 27 that had January gains of at least 3.75% finished with a higher S&P 500.

The second point is powerful.  “This appears to be the last leg of this bull market.  The current bull market will be 1400 days at end of this calendar year—and usually in the last leg there is a lot more strength; that’s typical.”

Dony says the average bull market since 1940 has lasted roughly 1600 days, or 4.38 years, and is then followed by a bear market of some kind.  He is calling for late 2012 to be the end of the current bull market in both stocks and commodities.


Donald and I talk every week about junior oil stocks.  He warned me his theory is aimed mostly at the S&P 500, not junior oil stocks–even though his call for Brent oil late this year is $148/barrel.  His Q1 target of $126/barrel was perfect.

“It’s not as relevant for commodity stocks, though things move together as a degree.  If the Dow goes up, then Canada will follow suit.  Maybe not as much, but we won’t go down to 11,000.  Our markets have not really rallied, so we’re a better value.  But a rising tide is not lifting all boats in the energy sector. In sectors like energy, it’s all about stock selections—rifle shooting.”

The simple reason for this is that 80% of all stocks in the US are trading above their 200 day moving average (dma), whereas in Canada, only 46% are, and it’s been that way for a couple of months.  This means it’s a stronger bull market in the US; there is more support for stocks.

“That’s why we’re seeing a lot more volatility in the Canadian indexes.  We’re near that 50% level.  When markets start to correct we’re going to see a lot more pullback.”  He estimates the TSX Composite Index will bottom out this correction just below 11,500, which is a 10% retreat, whereas he’s forecasting the S&P to only drop 5-6% to the 1375 range.

To conclude, Dony is anticipating a good year for stocks—which is hard to believe in this April swoon. As long as this April’s low is above the December low, his theory is intact.

“Right now it doesn’t look like we’re going to have anything close to the January low. Are we going to drop 700 points on the Dow in next few weeks? I highly doubt it. In that perspective, we still have higher highs and higher lows, though they may not be at same percentage incline.

“In fact I hope it isn’t—if it is, then there’s more of a chance of it (the bull market this year) blowing right up.”

by +Keith Schaefer

P.S.  I am a paying subscriber to Dony’s service, and at $120 a year it’s the second best newsletter value out there ;-).

How Exporting LNG Could Bring Serious Wealth to the U.S.

0

Where will the wealth created by the fast growing Liquid Natural Gas (LNG) market be concentrated in the coming years?

In a word–Australia. It’s the #4 exporter of LNG in the world already, and seven new plants are in various stages of planning and development, which would require $200 billion in capital investment–and lots of jobs.

By comparison, America, which produces massive amounts of natural gas, sends a shockingly small amount of the resource abroad.

Both are close to markets – Australia is closer to Asia, which imports vast quantities of LNG, but the U.S. is also relatively close to these markets and closer to Europe, which holds some major LNG consumers, like Spain and France. Both also have robust natural gas production.

And yet Australia is light years ahead of America in sending LNG overseas. How far? about 800 billion cubic feet (bcf) per year.

Now before we explore that gap further, here’s a short-version background on LNG…

LNG is created by cooling natural gas to minus 256 degrees Fahrenheit, which transforms the gas into a liquid. This liquid has about 1/600th the volume of natural gas, making its transport over long distances much simpler —and much more economic.

While turning a gas into a liquid may seem to be the stuff of science fiction, it has its roots in the 19th century when Carl Von Linde, an engineer in Munich, built the first practical compressor refrigeration machine. The first LNG plant was built roughly a century ago in West Virginia.

——————————————
Is This “New” Bakken Play Ready To Boom?

It’s not the Bakken most investors have come to know.

But I expect that all to change, especially now that one small company operating here has just hit TWICE on a HUGE new play–validating thousands of acres.

That’s why company insiders have been loading up on shares… AND why brokerage firms have price targets 50% to 100% higher than today’s share price.

As an OGIB reader, you can get the full update on this high-potential growth play — here in my new findings. Go here for free access.

——————————————

Of course, large-scale users of natural gas prefer to deal with the regular kind–not liquid and frozen. Since gas is easier to move and doesn’t need to be refrigerated, companies had to then develop ways to reverse the process. So you have to liquefy the gas to move it, and then “re-gasify” the natural gas to use it.  That’s a lot of work and means large infrastructure investments are required.

The gas is converted to liquid at liquefaction plants (LNG export terminals.) It is then transported in special ships that use auto-refrigeration. These LNG ocean tankers actually use a small amount of the LNG – 3%-4% during an average voyage—to power the ships. These tankers can carry around 135,000 cubic meters of liquid natural gas, which works out to about 3 billion cubic feet of warm natural gas.

To give you an idea of how much gas that is, 23 ships a day could feed ALL the US demand for natural gas.  There are now roughly 375 ships in service worldwide.

The ships then go to an LNG import, or regasification, terminal where the LNG is converted back to a gaseous state and then either stored in tanks or sent through pipelines.

The Asian market is a major destination for LNG exporters. Japan is by far the world’s largest importer of LNG, bringing in nearly 71 million tons (8.52 bcf/d)—or almost 31 percent of all global LNG imports, according to Unit Economics.

South Korea is #2 at 34.5 million tons (4.14 bcf/d), or roughly 15 percent of global imports. Taiwan (11.3 million tons/1.36 bcf/d) and China (9.7 million tons/1.16 bcf/d) also account for a significant portion of LNG imports.

Asia isn’t the only major LNG import market, though. Europe brings in large amounts as well.  Spain is the third largest importer of LNG with 27.3 million tons (3.28 bcf/d) coming in during 2010. The United Kingdom and France are also major importers, bringing in 13.4 million tons (1.60 bcf/d) and 10.2 million tons (1.22 bcf/d) in 2010, respectively.

According to the U.S. Energy Information Administration (EIA), the U.K. received 55 percent of its LNG exports from Qatar in 2009. That same year significant quantities of the hydrocarbon entered the U.K. from Trindad and Tobago (a surprisingly robust LNG exporter with 15.4 million tons (1.85 bcf/d) sent abroad in 2010), Algeria, Egypt and Australia.

Now that we’ve covered the basics of LNG, we can dive into the LNG industry in Australia to see what the U.S. might learn from the Land Down Under.

Australia only trails Qatar, Indonesia and Malaysia in LNG exports. In 2010, Australia sent 872 billion cubic feet (about 19 million tons) abroad, which was a substantial improvement over the 714 BCF exported in 2009, says the EIA.

That’s just over 8% of the world’s LNG exports. By comparison, Qatar does 25% of all LNG exports. Unit Economics states that Australia could contend with the Middle Eastern country for top spot as early as 2016.

Not surprisingly, most of Australia’s LNG exports go to the Top 4 importing countries—all in the Far East. Japan gets about 70% of Australia’s LNG exports, China gets 21%, South Korea 5% and Taiwan 4%.

There are only two LNG liquefaction plants in Australia right now, but seven additional export facilities are under construction, and four more are planned. Unit Economics reports that if all of these facilities come on line and produce their projected capacities, Australia will send a staggering 95.7 million tons (11.5 bcf/d) of natural gas abroad per year, versus the 19 million tons (2.28 bcf/d) it is exporting now—a five-fold increase!

The capital investments—and the jobs created by it—are enormous.  The Australian major Santos Ltd., along with Petroliam Nasional Bhd., are planning on shelling out $45 billion to create three LNG export facilities that would be able to convert 20.8 million tons of coal seam gas into LNG each year, reports the Wall Street Journal.

Other prominent players in Australian LNG are the BG Group PLC and the Australia Pacific LNG consortium, which is led by ConocoPhillips and Origin Energy Ltd.

“LNG is simply in high demand. and it’s not just the consequence of Fukushima,” Jon Skule Storheill, chief executive officer of Awilco LNG, told Reuters, referencing the nuclear disaster in Japan that has prompted the country to rely more heavily on LNG. “There’s Korea, there’s Taiwan, this market is just strong. Gas is clean, it’s available and it’s cheap.”

America, on the other hand, has only two export terminals. The terminal in Kenai, Alaska, which was built in the 1960s, was idled in November of last year. (At the time, ConocoPhillips’ spokeswoman Natalie Lowman told The Associated Press the plant will be in preservation mode until spring 2012, at which time the company will re-examine the facility.)

The other is Cheniere Energy’s Sabine Pass LNG Terminal, near the border of Texas and Louisiana. This station has 4 billion cubic feet per day of capacity.

Overall, the US exported 0.2 bcf/d of LNG in 2011, according to the EIA—a total of 71.5 bcf.  Australia almost does that in just one month.  The U.S. sends most of its LNG exports to Brazil, China, Japan and South Korea.

So How Does the US Get In On the Global LNG Action?

The LNG market is growing, and its future looks bright.

Some industry analysts predict demand for LNG globally will increase 40% in the five-year period from 2010 to 2015. This would make the annual market for LNG roughly 300 million tons.

The U.S. has the fifth-highest amount of natural gas reserves in the world, with the EIA putting the number at 273 trillion cubic feet. By comparison Australia has the 12th-highest natural gas reserves, with “only” 110 trillion cubic feet. But, as  stated above, Australia was able to ship more than 12 times as much LNG overseas in 2010 than the U.S.

The largest obstacle the U.S. faces in the LNG market is its lack of export/liquefaction terminals. With the Kenai facility going idle, the Sabine Pass terminal is the only facility in America even close to being able to regularly send LNG overseas. And even that could still be a few years away.

Now what about building LNG liquefaction plants?  Unit Economics says it can cost $3 billion for each million tons of annual capacity for the entire liquefaction supply chain, which includes production, pipelines, the port and the facility itself.

The Wall Street Journal reports there are seven additional projects seeking approval from the Department of Energy to ship LNG to most foreign nations. If all of these projects gain approval they could handle about 25 percent of U.S. gas production. However, the news source reports that approval for all of the facilities is unlikely.

An additional hurdle to the LNG market in the U.S. is political opposition to sending the energy source overseas. The American Chemistry Council has warned the U.S. government that it “should not undermine the availability of domestic natural gas,” but is not necessarily against exporting the substance.

The Sierra Club is concerned that exporting more natural gas will cause companies to increase their fracking operations. While there has been little to no evidence that fracking itself harms the environment, a groundswell of opposition to the practice has emerged, making investing in greater production difficult for the industry.

Still, for all the hurdles in exporting LNG, the U.S. also many opportunities.

In mid-March Japanese officials planned to meet with a delegation headed by Deputy Energy Secretary Daniel Poneman to reportedly request LNG exports to Japan. This appears to be a major step, as Japan had previously shied away from American LNG due to uncertainty over whether Washington would allow it to be exported.

As mentioned, Japan’s thirst for LNG is insatiable, and it will only grow stronger as the country scales back on its use of nuclear power following last year’s Fukushima Daiichi nuclear disaster. (Before the disaster, nuclear power accounted for about 30 percent of Japan’s energy production. That’s a large hole Japan will need to fill.)

Other markets that could be exploited by the U.S. are the U.K., France and Spain, all three of which are among the largest importers of LNG in the world. While Australia does send some LNG to these European countries, most of the U.S. competition will come from African countries like Nigeria and Algeria, as well as Qatar.

Another positive sign for U.S. LNG exports is that they appear to have the support of Energy Secretary Steven Chu, who has stated that sending the hydrocarbon overseas would allow America to cut into its trade deficit.

“Exporting natural gas means wealth comes into the United States,” he said, reports The Wall Street Journal.

There is much work to be done in the U.S. LNG industry to help it catch Australia—but the economics are powerful if it can.  The gears appear to be moving in the right direction, as both international markets are opening up, domestic production increases and LNG liquefaction facilities gain approval and come on line.

– The OGIB Research Team

Why the U.S. Desperately Needs an East – West Oil Pipeline

0

Editor’s Note:  Everyone, it seems, is talking about the Keystone pipeline. Recently I wrote a story on a mostly unexplored topic in the U.S gas price debate – a problem that could soon affect oil refineries and the price consumers pay for gas on America’s east and west coasts. You see, drivers on both coasts – but especially the heavily populated east coast – are increasingly vulnerable to sharp increase in gas prices, as I explain below. (I wrote this story for BusinessInsider.com – one of the top business sites in the world. A link to the full article follows my excerpt below.)

by +Keith Schaefer

Forget Keystone  – the U.S. Desperately Needs an East-West Pipeline

In the debate over rising gas prices, one largely overlooked issue is the lack of US oil pipeline distribution to the East Coast, where refineries that must import higher priced Brent crude are being shut down.

America has more than enough cheap domestic oil, thanks to the North Dakota Bakken and the Canadian oilsands. And it doesn’t face a refinery crisis in terms of capacity – after all, even though the US hasn’t built a new refinery since 1976, oil refining has actually increased by 2 million bopd to 17.7 million bopd since 1985 (and US refinery demand has been steady at 14.8 million bopd since 2005).

Instead, the real problem is that coastal refineries can’t source the cheaper North American crude. The Brent oil price fluctuates widely with geopolitical news. A stable, nationwide refinery system—well connected with pipelines—is one area where the US can help control price surges in local markets. Few things affect local gas prices like the shutting down of an oil refinery – and right now, the East Coast is at risk of losing three.

Politicians talk to the potential of the Keystone XL to bring cheaper Canadian crude to the Gulf Coast. But this north-south pipeline isn’t as badly needed as west-east lines that can carry cheaper American and Canadian crude from Cushing, Oklahoma to money-losing refineries on the East Coast. Today, the country’s five oil districts are not well connected by pipeline–each district must rely on its own crude supplies.

Only the Midwest and Gulf Coast refineries have access to all the new cheap crude coming out of the US shale plays and the Canadian oilsands. As a result, consumers in these regions enjoy WTI pricing – some of the lowest retail gasoline prices in the world.

Only the Midwest and Gulf Coast refineries have access to all the new cheap crude coming out of the US shale plays and the Canadian oilsands. As a result, consumers in these regions enjoy WTI pricing – some of the lowest retail gasoline prices in the world. With no pipelines from the heartland, refineries on the east and west coasts are forced to use imported crude based on Brent pricing—which is $20/bbl more than WTI, $40/bbl more than Canadian light oil, and $50/bbl more than the huge new supply of Canadian oilsands crude.

These coastal refineries are having to buy crude at higher international prices and then sell the finished product into a US market that enjoys some of, if not the, lowest retail gasoline prices in the developed world. This leads to serious financial losses for the refineries and, as a result, more energy companies are looking to get out of the refinery business. Right now there are three refineries up for sale on the East Coast – two by Sunoco and one by ConocoPhillips – and more could be coming. Altogether, these three plants have a refining capacity of over 800,000 bopd. If these shut down, the entire eastern seaboard, but especially the US Northeast, could see a supply crisis and a record jump in gas prices this summer just as the driving season hits top gear.

But this would not be happening if these refineries – and the others along the east and west coasts of the US – could access all the cheap light oil being produced in the North Dakota Bakken and other shale plays in the US. Or the Canadian crude that’s even cheaper. That means more pipelines – east-west pipelines, not north-south. That cheap domestic crude has to flow to the coasts and help make those refineries profitable again. But to be clear, all that cheap crude getting to coastal refineries – east or west – won’t lower gasoline prices, but it would likely prevent these refinery closures, and the massive price hikes that could happen along with it.

A recent study conducted by Bentek Energy (Crude Awakening: Shale Boom Hits Oil) found that North American crude production will increase 36 percent, or 3.1 million bopd, by 2016 due to shale oil plays and the Canadian oilsands. The firm notes, however, that this positive outlook on supply is undermined by the fact that there is inadequate transportation capacity to get that oil to refineries. It’s tracking the development schedules of 75 pipeline expansions, 25 rail expansions and 7 refinery expansions—though the near term expansions are mostly in the Gulf Coast which already holds half the US refining capacity. That’s little comfort to the drivers on the east coast.

Investing in Offshore Drilling & Deepwater Exploration

0

Editor’s Note:  In 2010, offshore drilling stocks got crushed. A lot of that had to do with the Deepwater Horizon oil spill.  But that tragedy also opened the door for investors to buy into big names like Transocean — at a major discount — which would later offer opportunities for very good capital gains. That’s why today my inbox is often filled with questions about the state of offshore drilling. So, I’ve asked my colleague Michel Massaud, publisher at BeatingTheIndex.com, to give us an overview of the sector — an offshore drilling and deepwater exploration ‘primer.’ Here’s Michel with today’s story…

————————————————-

Offshore drilling is the most complex and expensive way of accessing oil and gas reserves, particularly when it comes to deep water and ultra-deep water exploration activities.

While presenting the industry with its biggest challenges, deep water exploration and development yields the greatest potential rewards and healthy profit margins to the oil service companies involved.

The rising complexity and costs of such endeavours demands huge capital investments, long term commitments, higher efficiencies and a growing reliance on technology in order to reduce uncertainties.

The market fundamentals for oil service companies remain solid, oil prices are stubbornly holding their ground above $100 per barrel in a tough macroeconomic environment. The resiliency of high oil prices is fuelling increasing exploration and production spending by operators as the industry pushes further offshore into ever-deeper water. By 2020, offshore oil production is expected to account for 34% of the global output up from 25% in 1990.

offshore-drilling-rigs

Offshore drilling companies are seeing a significant increase in tenders and requests from customers, particularly for the ultra-deep water rigs which are commanding higher daily rates for its units. The brightening outlook mirrored by record backlog orders and rising rates encouraged the industry to focus on adding new equipment in all market segments in a bid to provide the most versatile fleets of mobile offshore drilling units.

Jack-up rigs are mobile, self-elevating drilling platforms that are towed by tugboats to the drill site with water depth of up to 400 feet. Jack-Ups are equipped with tubular structure legs that are lowered to the sea floor where jacking elevates the hull above the water surface before drilling operations begin.

Semi-submersible rigs operate in a semi-submerged position with the lower hull ballasted down below the waterline. The rig consists of a deck which contains working areas, equipment and living quarters that is able to carry drilling operations in deep and ultra-deep waters of up to 10,000 feet in water depth.

Drill Ships are self-propelled ships equipped for drilling in water depths in which jack-up rigs are incapable of working. They can drill in deep and ultra-deep waters in up to 12,000 feet of water depth.

reserve-discoveries-by-water-depth

Rising oil prices have also spurred a construction boom in drilling rigs; the cost for a drilling ship easily surpasses $600M per unit where it is leased at $500k/day or more on 2 or 3 year contracts. The Jack-up market is seeing increased demand in Mexico, the North Sea, the Middle East and Asia while the floaters market which includes ultra-deep water rigs has been improving markedly in Brazil, Africa and the Gulf of Mexico.

“There’s always a bull market somewhere.” There is more truth to this than most investors realize. And right now one of the biggest — if not THE biggest — bull markets in the entire Energy Patch is quietly taking shape. I’m referring to the technological revolution in oil & gas — the technologies, for example, that can increase yields by 4 to 7 times… launch huge new “discovery” fields… or even “extend the lives” of older fields. It is exactly these kinds of innovations that are creating triple-digit profit opportunities in the Oil & Gas Investments Bulletin portfolio. To learn more about what’s driving these opportunities in my OGIB personal portfolio — and how it all works, keep reading here.
————————————–

The New Sweet Spot in North America’s Oil Patch

It’s one of the hottest picks in the OGIB portfolio… A company operating in the heart of one of North America’s fastest-growing shale oil plays — with major short-term gain potential.

And in my newest research, I explain how recent drill success could see this company’s production more than double AND “slingshot” its valuation.

Follow this link to get it.

————————————–

On top of strong oil prices, successful exploration drilling results continue to be reported. Last year, 23 discoveries were announced in 12 different countries in an average water depth of 6,200 feet representing the sixth consecutive year of 20+ announced discoveries.  Successful exploration results pave the way for development drilling over the coming years which is another factor in driving future demand.

For instance, Petrobras (a Brazilian semi-public multinational energy company) will be renting 26 rigs for the next 15 years in order to develop its deep water oil field discovered back in 2006. The oildfield known as Tupi holds an estimated 8 billion barrels of light sweet oil.

udw-supply-and-demand

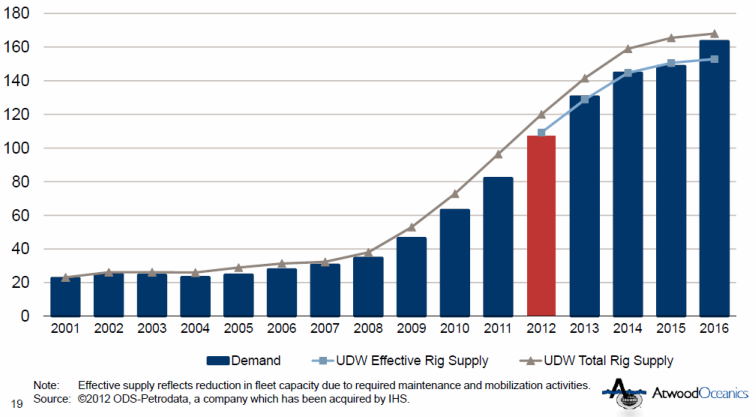
In contrast to Brazil’s newly discovered deep water prospects, the Gulf of Mexico is an established deepwater region which is also seeing rising activity levels. The industry expects drilling activity to reach and surpass the pre-Macondo level of about 30 wells by early 2013. Ultra-deepwater rig demand is expected to increase dramatically through 2016 as exploration activity drives future development demand growth. Even with the construction boom, the ultra-deepwater utilization is expected to remain tight in the coming years.

Not surprisingly, deep water’s contribution to global oil output is expected to reach 13% by 2020 up from 0% in 1990. Declining production from large onshore oilfields has to be replaced somehow and the era of easy to extract cheap oil is behind us. The following offshore drilling companies provide you with a strong exposure to the offshore oil services sector and a broad geographic reach since the world is their playground:

Company Name

Ticker & Price

Dividend

2012E Yield

Atwood Oceanics

ATW 45.61 [+0.74]

Diamond

DO 68.51 [+0.57]

$0.50

0.70%

Ensco

ESV 56.24 [+1.63]

$1.40

2.40%

Noble

NE 38.77 [+0.57]

$0.57

1.50%

Ocean Rig

ORIG 16.80 [+0.25]

Pacific Drilling S.A.

PACD 10.32 [+0.41]

Rowan

RDC 35.53 [+0.67]

Seadrill Limited

SDRL 38.70 [+0.89]

$3.00

7.50%

Transocean

RIG 53.095 [+1.655]

$3.16

6.20%

Vantage Drilling Company

VTG 1.41 [+0.11]


Finally, there’s no free lunch as investing in any sector carries its risks. For offshore drilling companies, you’ll want to keep in mind every operator faces risks ranging from storm damage to volatile commodity prices. Offshore drilling accidents, while rare, may result in significant damage or a total loss of a rig.

Capital budgets set by E&P companies are dependent on commodity prices; a sharp drop in oil prices will result in an oversupply of drill rigs on the market as capital budgets are scaled down. These companies usually borrow in order to finance construction of new rigs – What happens if prices collapse and contracts are renewed at much lower day rates? Can the company afford to service its debt? For dividend paying companies, future dividends depend on 3 variables of paramount importance: the business outlook, the debt leverage and the contract coverage.

– Michel Massaad
Editor, BeatingTheIndex.com