Duvernay Shale – It’s Make or Break for this Huge Shale Play

0

The size of the prize in the giant Duvernay Shale is BIG—Canadian brokerage firm CIBC Wood Gundy said in a June 14 report the oilpatch could recover 2-5 billion barrels of liquids and 150 TRILLION cubic feet of gas.

Who are the junior and intermediate stocks that have the most exposure to the giant Duvernay Shale?

Two charts below tell the tale. The first outlines just raw acreage positions. The second table below—two months old now—shows how limited the drilling has been in the Duvernay but highlights the land positions of the active players in the Duvernay.

BMO Capital Markets (Panel Discussion on the Duvernay May 16, 2012)

INTERMEDIATE PLAYERS

There are some intermediate producers in the Duvernay play, such as Yoho Resources (YO-TSXV), Celtic Exploration (CLT-TSX), and Trilogy Energy Corp (TET-TSX) (33% partners), and Bellatrix Explorations (BXE-TSX) and Athabasca Oil Sands (ATH-TSX). Not only have they active in the Duvernay, they’ve been more transparent about their results.

The map below from Yoho Resources shows recent Duvernay drilling activity into the Kaybob area of northwestern Alberta. The Kaybob area is one of the richest liquid rich areas in North America just in the Montney play, which sits above the Duvernay here. The Duvernay makes this area some of the sexiest, most prolific acreage on the continent.

In the Kaybob area Trilogy Energy, Celtic Exploration and Yoho Resources each have a 33% interest in various Duvernay rights.

Since 2010 the partnership has drilled four wells into the Duvernay with three on production and one waiting completion. Of the three producing wells, two tested between 930 to 1830 boe/d. The first was significantly less because it only received six of 13 frack stages.

In particular Trilogy Energy has been one of the most active smaller players in Duvernay exploration. Trilogy has over 200 net sections of ‘prospective’ (what they think has the Duvernay) Duvernay acreage and plans to spend $40 million in the Duvernay in 2012. Trilogy plans to continue with its partnership in the Duvernay and also drill two (100% interest) wells in 2012.

The Most Recent Duvernay Data (from the juniors)

As of April 2012 the two most recent Duvernay well results to come into the public domain have been from Bellatrix Exploration and Athabasca Oil Sands. Bellatrix was drilling in the gas/liquids window and Athabasca in the oil window.

Bellatrix Exploration drilled its first horizontal well into the Duvernay, to a measured depth of 4,700 metres with a 1,200 metre horizontal leg and 15 frac stages. Total well costs were $10 million according to ScotiaBank Equity Research.

Bellatrix reported that its first Duvernay well flowed dry gas at a restricted rate of 5.6 mmcf/d for the first 30 days. However, National Bank stated that the well had initial flow rates as high as 10.0 mmcf/d.

A research note by AltaCorp Capital reported downhole pressure on this well at over 9,000 psi (this is a very high and will likely lead to a large gas resource in place). AltaCorp also noted that management expects upwards of 4.3 – 4.5 tcf of resources across their 43 net sections of Duvernay rights. Assuming a 30% – 40% recovery rate, that would be ~1.2 tcf net to Bellatrix.

The bad news is the liquids content was initially reported as nil. And the economics of this play lives and dies by the liquids content; specifically condensate. I think the play needs at least 80 barrels of condensate per million cubic feet of gas, IMHO.

Most analysts believed that after the frack fluid clean-up is complete, this well could flow liquid rich gas in the neighborhood of 30 bbl/mmcf.

While 30 bbl/mmcf is ‘OK’, it is not what Bellatrix’s management expected. Most analysts believe estimates were somewhere between 70 -100 bbl/mmcf, which is similar to the Trilogy/Celtic/Yoho Duvernay wells which are flowing between 75 – 110 bbl/mmcf of liquid rich gas.

The other most recent Duvernay well result that has been released came from Athabasca Oil Corp. (note the recent name change from Athabasca Oil Sands). Athabasca’s Duvernay well is located in the Kaybob area as well and had a reported flow rate of 650 boe/d over a 16 day test period. This flow rate breakdown in their news release was 390 bbl/d of light oil (44 API) and 1.5 mmcf/d of gas.

The drilling costs for Athabasca were $5 million and the completion (fracking) costs added an extra $10 million. Given the high price tag, ScotiaCapital said the economics would be marginal at best. However Athabasca believes it can get total well costs in down to $10 – $11 million.

The report also noted that this “is the first light oil strike in the play.” If Athabasca can prove that the Duvernay can be as much an oil play as a gas play, the size of the prize becomes that much more dynamic. You can bet industry will be closely monitoring the well data over an extended period of time to calculate some long term economics.

Athabasca intends to complete two more horizontal Duvernay wells this year, one located on the western extent of its lands, in the condensate window of the play, and the other in the Kaybob area to test the middle of the condensate window.

BMO Capital Markets even believes that Athabasca could announce a Duvernay JV this spring/summer to validate the capital they have spent so far.

Conclusion

It’s still early days in developing the Duvernay, and the industry is still in its learning curve on how to get oil and gas out profitably, and consistently.

In the remainder of 2012, Duvernay data will be a hot commodity. CIBC Wood Gundy says 50 Duvernay wells have been spud to date, and 14 wells reported to date have a median liquids yield of 80 barrels per million cubic feet of gas (bbl/mmcf/d).

Wells coming off confidentiality status will be closely monitored. Good Duvernay results could lead to big dollar joint ventures, or even outright purchases of junior companies by the intermediates or seniors.

Indeed, if there is consistent good news later this year, expect to see M&A activity pick up a lot. The seniors in the Duvernay have a lot riding on the economics here, and that could be great news for shareholders of junior and intermediate stocks with big Duvernay land positions.

by +Keith Schaefer

Duvernay Oil & Gas Stocks: Which Companies Will Emerge the Winners?

0


In many ways the oil industry is a fashion industry, and in 2011 the exciting new model on the investment bankers’ catwalk was the Duvernay shale.

Over $2 billion was spent acquiring big land packages,

FSRUs: The Leading Edge of the LNG Market

0

In Part 1 (The Race To Supply LNG), I explained how the Japanese will most likely solve its power shortage, now that there are NO nuclear plants running.

One of the biggest answers is LNG—Liquid Natural Gas—and an emerging LNG technology that is growing around the world… and could be a fast answer to Japan’s dire need to quickly replace their nuclear power.

It’s called FSRU—which stands for Floating Storage and Regasification Unit. It’s a floating LNG import terminal — at less than half the cost of an onshore facility.  The benefits to Japan now—which is in a proverbial “space race” to meet its electricity needs, are that they can be ordered, made and delivered in 2-3 years, vs. 5-7 years for an onshore import terminal.

FSRUs and onshore LNG import terminals take LNG and regasify it—taking it from the liquid form, where it is reduced 600:1 in volume and expanding it back into a gaseous form where it’s usable to make electricity in your home, and for other uses.

Both facilities need a berth for the LNG ship, storage tanks and pipelines. But the traditional, land-based terminals can cost upwards of $700 million for a facility with a peak capacity of about 7.75 million tons per year (around 1 bcf/d). Terminals operate at roughly half of their peak capacity.

These onshore facilities can take 5-7 years to be planned, constructed and brought online, which means they are not ideal for Japan’s current situation.

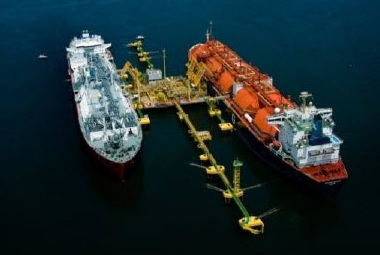
FSRU - LNGAs I said, FSRUs are custom-built vessels — similar to the LNG carriers but with the ability to turn LNG into its gaseous form.
FSRUs not only get to market faster, but cheaper:  A newly built FSRU costs close to $260 million, according to Unit Economics (and they do the best research in this sector, by a nautical mile).

One company has even started converting old LNG carriers into FSRUs, for which Unit Economics says the cost is more like $160 million—and can be ready in just 14-16 months.

Another advantage is that they can be moved to wherever demand is highest for the regasification of LNG.

However, FSRUs have one big drawback—less capacity. Most have a peak capacity of around 4 million tons annually (about 500 million cubic feet per day), though some of the new ones are getting closer to 1 bcf/d.

A potential drawback for the Japanese could be that this technology is so new, there are only 10 working in the world right now, with another seven being tendered.

So while they are proven, they cannot yet be called mainstream. But there are already several large shipyards able to build them, and competition for bids is intense; i.e., there is a healthy supplier’s market.

Still, it should be noted that even if Japan goes with FSRUs, it will still to take some time for them to start importing LNG. This time gap is another reason Drolet believes nuclear reactors will have to come back online to meet the country’s energy needs.

by +Keith Schaefer

Publisher’s Note:  LNG is one of the only bull markets right now in energy.  The FSRU market is at the leading edge of this.  They are new and exciting, and the growth rate right now is huge—likely 100% in the next two years.  And the profits are rolling in fast for one of the leading companies in the space.  This company has already built and sold 4 of them.  The thing to keep in mind here — FSRUs are different than LNG carriers in that they are much longer contracts (10- to 20-year contracts), with great long-term cash flow—exactly the thing you can plan a dividend around.

And that’s what this company has done — having increased its dividend in each of the last four quarters.  The total dividend increase during this time is 40%. How many companies are doing that in this market?

Analysts are calling for quarterly EBITDA (Earnings Before Interest, Taxes, Depreciation and Amortization) to DOUBLE in the next quarter—a 100% increase in just one quarter. Its utilization is 100%, and operating profit margins are an eye-popping 80%.  That’s why they are one of the most profitable companies in the worldwide energy sector.

I bought the stock this week myself.  And I encourage you to learn all you can about this play — Click here to keep reading…

by +Keith Schaefer

The Race To Supply Japan with Liquid Natural Gas (LNG)

0

Dear OGIB Reader,

As of this month, May 2012, Japan has no nuclear power for the first time in four decades.

Just over a year ago—before the Fukushima disaster caused by the earthquake/tsunami—nuclear supplied 26% of Japan’s power.

Taking all 54 reactors offline have left Japan with an “electricity black hole,” according to Thomas Drolet, President of Drolet and Associates Energy Services, Inc., a nuclear energy expert who has visited both Chernobyl and Fukushima.

“And Liquid Natural Gas will certainly play a major role in this scenario as Japan scrambles to keep the lights on,” he says.

Drolet estimates that Japan will want to increase LNG imports a further 2 billion cubic feet per day (bcf/d) on top of its already record imports in the coming two years.  And the need for power is so acute, they just can’t import it fast enough.

Japan imported a record 6.6 million tonnes or 11.5 bcf/d of LNG in April 2012.

While you hate to profit from someone else’s misfortunes, this is bullish news for the three LNG projects—one of which is now under construction—on Canada’s west coast.  It’s also bullish for the LNG shippers, where one year contracts are now being signed at $150,000/day—up from $40,000 only 18 months ago.

To give you a sense of what 2 bcf/d means:

1.   The three Canadian LNG proposals total 2.9 bcf/d (and those export terminals and ancillary services (pipelines) would cost roughly $10 billion in infrastructure).

2.   In the US, that would be a full 50% of Cheniere’s (CQP-NASD) Sabine Pass LNG terminal, the largest LNG export facility that’s being planned in the US (so far).

3.   Most LNG carriers can hold just under 3 bcf, so roughly new 17 ships (at roughly $200 million apiece) would be needed to make the trip from Australia or Canada to Japan.

But the prize is huge—natural gas in Japan is now just over $18/mcf.  That’s a great profit margin when gas is $2.25 here in Canada.

Drolet says the most likely path to restore power to Japan will be that some of the nuclear reactors will come back online.  He believes that about 25 of the 54 reactors will be reactivated gradually over the next 12-18 months (starting with this summer’s air conditioning and industrial peak demands).

But due to anti-nuclear sentiment among the Japanese people, and the government’s and several utilities’ commitments to other fuel sources, he doesn’t expect any more than that.

In this partial return scenario, he envisions that Japan will still have a 20,000 Megawatt equivalent (MWe) power deficit. He predicts that 15,000 MWe will likely come from LNG, with the remainder made up of 4,000 MWe from coal and a small amount (1000 MWe) of base load Geothermal power.

“Energy planners don’t want to put all their eggs in one basket,” he said.

15,000 MWe equals roughly 2 bcf/d.

BACKGROUND

Prior to the March 2011 Fukushima disaster, nuclear power accounted for 11% of total ‘energy’ consumption in Japan–but was 28% of electricity production, according to Unit Economics. Following the incident that number has dwindled until it finally hit zero early in May 2012.

This has caused a substantial energy shortfall with some major utilities, such as Kansai Electric – which provides power for Osaka, Kyoto and Kobe – saying they will not be able to meet demand. Due to this the country’s government is urging people and businesses in parts of the heavily industrialized west to cut their energy usage by 15%.  Talk about austerity!

Even before the nuclear plants were taken offline, LNG accounted for 17% of Japan’s energy consumption.

In 2010, this amounted to 70.7 million tons (about 9 billion cubic feet per day) of LNG—making them the largest importer in the world. In the 12 months ending March 31, 2012, imports totaled 83 million tons.

If LNG were to take the entire 11% of Japan’s energy needs vacated by nuclear power, that would theoretically mean that the country has to import an additional 45.7 million tons per year—or 6.5 bcf/d—of LNG.  Drolet suggests this is highly unlikely.

Even if the Japanese decided to completely replace nuclear power with LNG, Japan does not have the import capacity to do that.

Japan currently has around 30 smaller import terminals that are located close to the areas that have the highest energy demand as pipeline and storage capacity are limited in the nation.


According to Unit Economics, the country has roughly a theoretical maximum level 88 million tons per year (around 11 bcf/d) of LNG import capacity.

NEXT STORY:   The new technology innovation in LNG that greatly reduces costs and could fill Japan’s dire power needs much more quickly than ever before.
by +Keith Schaefer

Cultural changes in Japan following Fukushima Daiichi

There have been some shocking, obvious impacts in Japan after the Fukushima Daiichi nuclear disaster—and many others that are not so obvious.

Nuclear expert Thomas Drolet, President of Drolet and Associates Energy Services, Inc., has visited the country dozens of times over the past decades, and three times since the March 2011 disaster.

Here are a few examples of changes he has noticed in his travels there:

1. One of the most obvious signs of this lack of energy is that nights in Tokyo are now much darker.

2. He said that Geiger counters are now a common sight in grocery stores as people make sure that they aren’t buying food with radioactive particles.

3. In addition, he said that his Japanese friend’s wife inspected him with the Geiger counter before he entered their apartment.

4. Japan is heavily reliant on air conditioning and last summer businesses were forced to turn their units up to 78 degrees or so, rather than the more standard 72, according to Drolet.

This increased temperature led to many businesses allowing workers to shift away from the traditional suit dress code and begin dressing more casually. Drolet says that even when the fall and winter came, the less formal attire remained.

In addition to these more aesthetic changes, Drolet says that the disaster also led many Japanese citizens to question authority more, as both TEPCO and the government were widely perceived to be less than honest with the public in the aftermath of the incident.

by +Keith Schaefer

Investing in the Eagle Ford Shale Oil Play

0

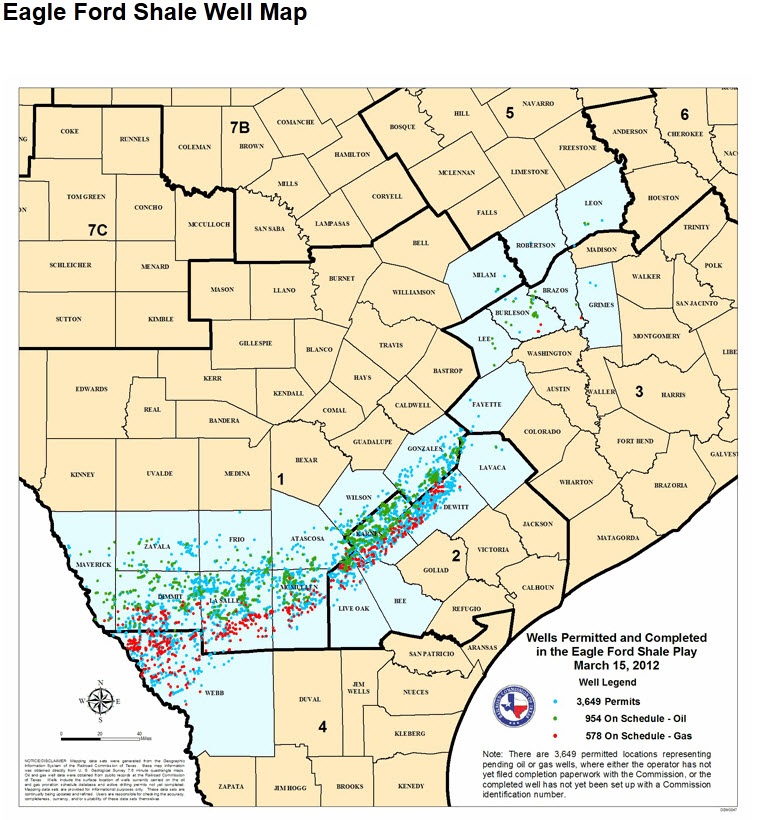
Two new tight oil plays in south Texas are attracting a lot of investor and industry attention—the Eagle Ford and the Eaglebine.

THE EAGLE FORD

The Eagle Ford has gone from obscurity in 2008 to now being the #3 play in all the United States (based on number of rigs drilling), after the Permian Basin in southwest Texas and the Bakken.

Pioneer Natural Resources (PXD-NYSE) says they get a 70% pre-tax rate of return at Eagle Ford.  EOG Resources (EOG-NYSE) says it’s 80% for them.

Marathon Oil (MRO-NYSE) says it’s over 100% for them on some condensate wells (condensate is a Natural Gas Liquid that’s really more like a very light oil and often gets a better price than oil).

The formation is 400 miles long and 50 miles wide with an average thickness of 250 feet—thicker than the North Dakota Bakken. It is estimated that the Eagle Ford formation has a total recoverable resource of roughly 3 billion barrels of liquids (that’s oil and some NGLs) with a potential output of 420,000 barrels a day (bopd).

In the western part of Eagle Ford, oil is dominant with about 78% oil, 11% natural gas liquids and 11% dry gas, while the eastern part has a higher percentage of dry gas.

This high oil and liquids content (think propane that goes in your BBQ, or butane that goes into a cigarette lighter) make the Eagle Ford a very profitable play.

Eagle ford shale


That’s why output from the Eagle Ford jumped almost sevenfold in 2011 to above 30 million barrels of oil equivalent. (But that is still well below what the Bakken produced—a staggering 128 million barrels.)

Eagle Ford production will continue to rise—production is forecast in 2015 to jump to  1.2 million barrels a day of oil equivalent including 750,000 barrels of liquids – with a surge in drilling permits (on a 25,000 annual rate) so far this year, which would be the highest level 1985.

SHALLOW, BRITTLE GEOLOGY

From a geological view, the Eagle Ford formation’s is shallow (less than 4,000 feet) with carbonate content as high as 70 percent and a low amount of clay. This makes the Eagle Ford more brittle and much easier to stimulate through hydraulic fracturing.

The horizontal wells drilled in the Eagle Ford are also shorter than in other plays such as the Bakken in North Dakota (4,000-6,000 feet versus 10,000 feet). This lowers the cost of drilling a well to roughly $5.5 million compared with more than $8 million in the Bakken. The time taken to drill a well in the Eagle Ford is also short at about 2-3 weeks.

Most in the industry point to Petrohawk Energy (acquired by BHP Billiton – NYSE: BHP) as the first company to realize the potential of the Eagle Ford — Potential which many see today, such as Marathon Oil (NYSE: MRO). Its COO Dave Roberts has stated that the Eagle Ford is the best play on unconventional resource liquids in the United States today and perhaps even the world, calling it “the top basin we have in the world today.”Marathon is putting its money where its mouth is, spending roughly 30% of its $5 billion worldwide budget on the Eagle Ford. Marathon alone expects its Eagle Ford production to grow from 9,000 bopd in Q4 2011 to 100,000 bopd in 2016.

These factors have led to a land boom in the Eagle Ford in Texas. The cost of drilling rights there has risen from less than $4,000 an acre at the beginning of 2010 to more than $20,000 an acre according to IHS Cera. Some deals have priced the land higher.

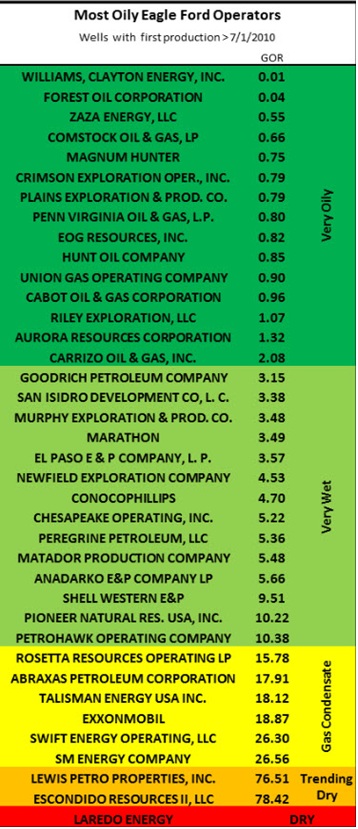
For example, the Indian gas company GAIL not long ago offered Carizzo (Nasdaq: CRZO), a small shale oil explorer in the Eagle Ford, $23,500 an acre.  Paying roughly the same per acre as GAIL, other large energy companies joining the land rush in Eagle Ford include ConocoPhilipps,  Marathon Oil, Norway’s Statoil (NYSE: STO) and China’s CNOOC (NYSE: CEO).

eagle operators

These large companies are buying the acreage from smaller explorers who can’t say no to the big money being waved at them by the majors, leaving more and more of the acreage to larger-to-medium companies like EOG Resources.

Production from the Eagle Ford over the next year is expected to expand by 200,000 bopd, which is roughly the same production expansion as the Bakken, according to global energy consultants Wood Mackenzie.  The production gains will be led by companies such as Conoco and Marathon which expect to double their production to 100,000 barrels and 30,000 barrels respectively.

THE EABLEBINE

The newest “hot” part of the EagleFord is the Eaglebine, which is the northeast extension of the Eagle Ford. The Eaglebine got its name from a combination of the name of the formation – Woodbine – and its proximity to the Eagle Ford shale.

The Woodbine formation is best known as the reservoir in the famous East Texas Oil Field. Since its discovery in 1930, the East Texas Oil Field has been the most productive oil field in the US.  Just south of Eaglebine is the South Kurten field where vertical wells in the last century produced as much as 200,000 barrels a day of oil equivalent (boe/d).  So there is a lot of oil there. Today, new horizontal drilling and completion technologies are being applied to the Eaglebine, which could be considered the northern extent of the Kurten field.

Drilling a well in the Eaglebine costs approximately $4.5 million apiece for the 6,000 feet lateral sections and the double-digit frac stages which are spaced about 225 feet apart. The time frame for such wells is similar to the Eagle Ford, at 2-3 weeks.

The Eaglebine and Eagle Ford share similar geology, as they are both situated above the Buda Formation and below the Austin Chalk.  However, the Eagle Ford is a carbonate rich organic, while the Eaglebine contains a large percentage of silica-rich sands interlaced in the organic rich shale. Because the Eaglebine is more porous than the Eagle Ford, lower horsepower rigs and lower fracking pressures can be used in the drilling process. And drilling and completing in the Eaglebine sandstones produce much less waste water—a big environmental benefit.

Craig McKenzie is the President and CEO of ZaZa Energy Corporation, which has over 100,000 gross acres in BOTH plays, says “the Eaglebine geologic horizon is thicker and has a higher sand concentration than that seen in the Eagleford core.  That gives it higher resource potential per acre AND at lower drilling costs.”

Another benefit for Eagle Ford and Eaglebine producers is that they get a higher price for their oil than in the Bakken.

The formations lie close to refineries on the US Gulf coast, lowering transportation costs by as much as $40/barrel over Bakken prices.

That’s because oil produced in the Texas and Louisiana region and sold on the US Gulf Coast is more closely aligned with global oil prices–Brent Crude out of London UK.  Landlocked US oil produced from the Bakken, for example, is transported to Cushing Oklahoma by pipeline. The huge glut of oil in Cushing, where storage containers are overflowing, is the reason why US NYMEX crude oil sells well below the global market price of oil.

A spokesman for Anadarko Petroleum (NYSE: APC) in the area described it this way: “The economics there [south Texas] are absolutely stellar.”

by +Keith Schaefer

P.S. Most of the boom in North America’s tight oil production so far has come from the Bakken formation in North Dakota. But Texas, the biggest producer in The Union, is experiencing a huge increase—in fact, a 230-fold increase in tight oil crude output over the past three years. And it’s just getting started… which is why I’m looking very close tabs on ways my subscribers can profit from what may become the center of a new oil boom in the U.S.


cambridge banner.png

Fundraising Dinner & Charity Auction in Memory of David Coffin

David Coffin, co-editor of the HRA Newsletters, passed away suddenly in February.  Cambridge House, along with David’s friends and colleagues, invite you to share an evening of fine food and drink, conversation and a celebration of David’s life, and of the positive impact on the mining business he loved and devoted his career to.

For more details, please go to: http://cambridgehouse.com/event/david-j-coffin-memorial-fundraising-dinner.
All Net Proceeds of the Dinner and Auction to: “The David J. Coffin Memorial Bursary in Geology”

Whether or not you are attending the dinner, DIRECT DONATIONS TO THE BURSARY FUND ARE GRATEFULLY ACCEPTED BY UBC: http://memorial.supporting.ubc.ca/david-coffin/

by +Keith Schaefer

“Waterless Fracking” – Using LPG for Greater Oil & Gas Recovery

0

Zeke Zeringue is a man with a plan. But the new CEO of Calgary based GasFrac (GFS-TSX) says shareholders need to understand it’s a long-term plan.

Zeringue took over as CEO of GasFrac in October 2011, 14 months after it went public on the Toronto Stock Exchange.

GasFrac is unique in the global fracking industry in that it uses no water, and there is now a growing database that shows its Liquid Propane Gas (LPG) technology dramatically improves the overall recovery of oil and gas out of wells.

The obvious environmental benefits, and promise of greatly improved well performance, made the stock a stellar performer in its first seven months. The share price moved up from its $5 Initial Public Offering (IPO) price to $14. The company gained coverage from many brokerage firms, national and regional.

But less than stellar sales growth throughout 2011 to back that up has now cost shareholders dearly, with the stock sitting at $5.50 after GasFrac announced its first financial guidance in Q1 2012—well below the market’s expectations. Zeringue says an industrial accident in January 2011, and a perceived higher cost for LPG has hurt revenue.

The new plan, he says, is to get a critical mass of GasFrac’s LPG fraccing units—called “spreads” in the industry—into one or two basins in North America. And he is also educating customers—new and old—how using propane is actually very effective, over the long term.

“This is a critical part of the strategy,” Zeringue said in a phone interview from Houston. “If you look at the price of propane in our jobs, and then the fact that we can re-use or sell that LPG, makes it more economic.”

“I’ll put that against the economics of water fracking production—where they get charged to haul water away for years—any day. That’s why I think LPG can stand up against water fracking costs today.”

The disposal costs for water in both the Marcellus Shale in the northeast US and in Texas are sometimes as much as $10/barrel—making water costs on a well $1-$2 million or more.

“We used to talk to facility people, but now we talk to production people. We educate customers on how to produce an LPG fracking job. For example you can now sell the propane you recover. And there are other ways to get economics out of our process.”

Zeringue says another part of his plan is to have GasFrac be more vertically integrated around LPG on the jobsite.

“If you look at LPG technology, I want GasFrac to touch every part of that, from propane delivery to everything. That’s a fundamental change.

“Recycling was mentioned in the previous strategy, but it wasn’t realistic. You have to understand how a job works and the infrastructure around it. When you look at recycling and capturing propane, it’s more than just putting a unit out there.

“We need to help clients understand how propane is different than a flowback of a fracking fluid. So we have to understand the surrounding infrastructure so we can sell that value-add service.

“In the past we have let the operator make most of the decisions regarding how they decide to handle the flow back. It many instances, GASFRAC has felt there have been better ways to do it—to get more value out of the LPG.

“We now analyze the job and recommend, based on the facilities available on job site, if the customer should flare, recapture or put it in their sales line if available.”

Zeringue says the other change in sales is that GasFrac wants to get a “critical mass” of jobs in two or three basins. “Critical mass” means enough jobs that keep two frack spreads busy, as they only need that many to make mobile propane recycling available. Recycling the propane reduces costs significantly.

“Our partnership with Green Field services is a prime example. They’re starting to use natural gasin their frac pumpers versus traditionally using diesel. If we can figure out how to tie in our gelling system, it will create an even more more environmentally-friendly frac.

GasFrac spent the first 15 months of its life as a public company doing a lot of one-time jobs, making sure the technology got tested in as many different basins (e.g. Barnett, Permian, western Canadian) as possible. But that’s very expensive, as it means a lot of down-time moving from job to job and amortizing all those costs over a small number of jobs—and over a small amount of revenue.

“We’ve done the market surveys now, and I felt we were still doing that,” Zeringue says, explaining the change in strategy. “Now we will be focused in basins. We have to take the study of what we have learned, and go promote those results where we are having the best impact.

“In the North, that is the Cardium (formation along the foothills of Alberta). The Cardium has some big players, and we’re now on the frack calendar of some of those people.

“In San Antonio, we have an early adopter with BlackBrush, so we now have a second operating area we can build on; it now gives us a base we can build from in south Texas. We’re in discussion with an outfit in the Niobrara (Wyoming/Colorado), hoping to build a base there.”

And the reason that GasFrac is continually getting initial interest, is the same reason I bought the stock in the first place—that LPG recovers more oil and gas (often a LOT more) than using conventional water or oil.

“This technology does make a fundamental difference when it’s being used,” Zeringue says, “and that is starting to gain us back entry into companies who were going to wait and see. The limited data we have clearly shows we make a fundamental difference in the production of these reservoirs.”

In their corporate presentation, GasFrac says they can increase the Estimated Ultimate Recovery (EUR) by 20-30%. In the early days of a Cardium well they were able to more than double production over water in the first two years.

GasFrac signs Non-Disclosure Agreements (NDA) with clients, so they must wait until the client releases well data into the public domain before they can use as part of their library, and sales pitch.

“We explain the differentiation (between LPG and regular oil or water fracks) and the key ingredient has been the ability to have comparative data,” says Zeringue. “This is first time I can go into a customer and show a material difference. Everybody else (in fracking) is the same, and the service is commoditized.”

Alright, I said. So how is this new sales strategy doing in the field since you came in as CEO?

“In the US, being a Canadian company, it has simply been a marketing effort. We’ve had a bevy of companies that we have introduced the technology to, and a significant amount of those have asked for quotes.

“That’s a critical stage. It means we’ve gotten past the vetting and we’ve got real interest. We just got note from Chevron and that helps. Chevron spent 2 years vetting our process through numerous third party safety audits and we were finally able to perform our first jobs for them in Q4 2011.”

In Canada, he says, a January 2011 industrial accident has had a “lingering effect” on sales. Several workers had third degree burns in a flash explosion on a jobsite.

“In the operations community in Canada, (sales) has been affected by the “wait and see attitude” to deliver it (LPG) safely. And we have, working with Shell and Husky. So there is data that we now have that validates us and we use that in our business development.”

Water has become a big issue in fracking—both the quality and the quantity. This should play right into GasFrac’s hands. But Zeringue says it’s still secondary for operators.

“Water has only been a BIG issue for last 6 months. The environment is not our lead punch, the science and economics are. I know this industry—“tell us what you’re doing for my neighbour”—that’s how they think. We’re saying we can have effect on your EUR—they say “Wow”; that’s my lead punch. If they’re under any pressure on water, that’s just a benefit.”

Zeringue’s knowledge of the industry also makes him realize that industry adoption of LPG will take time.

“This is not a sprint, it’s a marathon,” he says. “The adoption curve for this industry says it’s a marathon.”

by +Keith Schaefer

P.S.  My Canadian readers may know Michael Campbell, host of the Money Talks show.  Michael has invited on his show several times, and I’ve also spoken at his conferences. Today he has something to share with OGIB readers —
a workshop on options investing he’s putting together. You can read more about it here.
DISCLOSURE:  Keith Schaefer owns 1,000 shares of GasFrac (GFS.TO).


The Relationship Between Oil and Stocks — and How To Trade It

0
Dear OGIB Reader,Today’s story comes from Cory Mitchell, who explains how the charts of oil and the overall market are now hauntingly like the 2006-2008 period—but in the short term, that means now could be a good time to own stocks.- Keith

Commodities and stocks have been moving closely together since the 2008 financial crash.  But this relationship is starting to hit the rocks, with stocks moving higher and commodities moving lower.
In this nervous, overall market, it might seem logical to assume that stocks will begin to drop (more so than we have seen in the last few days) with commodities…but I propose a different likelihood.There is some strong recent chart history that shows oil and the stock market is trading a compressed version of late 2006-late 2008.  That should mean a continued love affair between the two sectors through to Q4 2012, with both rising (giving investors some love too)—but end badly, with both dying late this year or early 2013—just at slightly different times (think Romeo and Juliet).
In this article I’ll explain:
The current environment mirrors a pattern seen several years ago.
This pattern coupled with the long-term technical picture could drive the S&P 500 to 1500+ before the end of the year—a more than 10% jump from current levels. Oil is also likely to make another move higher boosting the energy sector in the latter part of the trend.
The rise is likely to create a stock market peak late in 2012, leading to a significant decline.If this materializes (or if it doesn’t), certain price levels can be used to as guides for trading this market.
The Recent Stock and Oil Relationship
Look back at 2006: oil dropped through the latter part of the year but stocks continued to climb.  During most of 2007 stocks and oil move higher, in unison, but decoupled in late 2007 with stocks going down and oil going up. See the divergence on this chart.
Figure 1. S&P 500 (Red and Green) Vs. Crude Oil (Pink), 2006 to 2010
Figure 1. SPX vs. Oil
Source: TD Ameritrade
The times of significant decoupling are marked “Divergence.” In the first divergence we have stocks up, commodities down. Later, we have stocks down, commodities up—a sign more typical of a major commodity top and nail in the coffin for equities. For example, it was that final push in oil up to $147 in mid-2008 as equities had already rolled over (peaking October 2007) that killed the equities at the end of the trend.   And then Romeo and Juliet collapsed together.
Right now, I see that we are in the same trading pattern, but only in the late 2006 part.  This means the commodity and equity top is coming…but likely not yet.
The Current Environment
Since 2009 stocks and oil have been moving in unison… until recently. Based on Figure 2 below, oil has been showing a slight divergence with stocks since hitting a high in May, 2011. The recent rally was unable to reach those heights and has started to decline once again.
Stocks on the other hand have hit new highs in 2012 — leaving the uptrend unquestionably intact up to this point.
Figure 2. S&P 500 (Red and Green) vs. Oil (Pink), May, 2010 to Current
figure 2. SPX vs. Oil short-term
Source: TD Ameritrade
The last few months are especially interesting — Oil has been declining since March and stocks have risen. To me this looks a lot like the occurrence which took place in the last half of 2006—at least the start of it.
Commodities overall, represented by the CRB Commodities Index, show the past and current divergences more clearly.
Figure 3. CRB Commodities Index (Blue) vs. S&P 500 (Green)
Figure 3. crb vs stocks
Source: Incrediblecharts
Note the similarity between now and 2006. Overall commodities and stocks are in an uptrend—but  stocks are pushing ahead as commodities decline—just like in 2006. We can see what happened in 2007 and 2008 following that divergence—in 2007 both commodities and stocks rallied until October, then an eight month divergence until the final collapse together.
Could that same scenario happen now? I believe it can, although I don’t believe we will have a massive spike in oil like we did in 2007 and 2008.
What the Current Decoupling Implies
If we are seeing another situation like 2006—with oil dropping and stocks rising (or at least holding steady)—it will be a good time to own stocks for the short term.  While markets always gyrate I continue to believe the current market environment is a favorable one for investors.
Also, the rally in stocks appears to be incomplete. If we look back to 2000 we see the market in a large expanding range as shown in Figure 4—higher highs and lower lows; the chart looks like a megaphone.
If that happens, I see the S&P 500 moving very close to upper portion of that expanding range this year. I don’t believe stocks will explode higher from current levels but rather continue making see-saw moves higher to near 1500 to 1550 on the S&P 500 (right below the expanding range threshold and near 2007 highs).  For investors that still means a lot of potential upside—likely 10%+ from current levels.
Figure 4. S&P 500 20 Year Monthly Chart (1992 to Current) – Expanding Range
Figure 4. SPX-long-term
Source: TD Ameritrade
What to Watch For
The situation now is similar to late 2006, leading into 2008. Oil could decline for the near term as stocks continue to rally, or at least hold above support levels (discussed shortly). The push higher in stocks presents an opportunity for investors to catch the tail end of this long-term rally which began back in 2009.
After a short-term decline (happening now) oil is also likely to follow suit putting in its high after the stocks market has already begun to decline—just like in late 2007.
Historically the energy sector shows strength late in trends, often to due to this last push higher in oil, as broader indexes such as the S&P 500 have already turned lower. Therefore, watch for the energy sector to pick up over the next several months as oil puts in a final thrust higher. I do not expect oil to rally aggressively as it did in 2008; it is more likely to peak at $120 or below.
How to Trade It
Nothing moves in a straight line and what has been discussed provides a general structure of what I believe will unfold. Short-term declines in the S&P 500 are likely to bottom out in the vicinity of 1340 or above (within about 30 points of current levels), ultimately rallying to near the 1500 region over the next several months.
Oil could continue to decline but is likely to begin moving higher, ultimately peaking after stocks have peaked—near $120 is likely to be high for oil before it too sees another significant decline (Romeo and Juliet die).
That leaves some time to buy stocks for what could be further upside. If the S&P 500 holds above 1340 look for the energy sector to be a leader late in the trend as the market continues to push higher.
In the closing months of 2012 I believe the upper band of the expanding range (the top of the megaphone) will have been tested in the S&P 500, and it will again lead to a major decline (October top again?). That stills leaves several months though that are likely to be good months for the markets, especially buying on pullbacks into support areas like we are currently seeing.
In terms of managing risk, 1340 is the level I am watching on the S&P 500; based on the technicals I believe the level should hold, for those who like to leave a bit more room 1300 is next level to watch. If the latter is breached it is a major warning signal. If support is found above these levels expect a move up to 1500 or slightly higher.

– Cory Mitchell, CMT

I Really Don’t Want To Do This But It Could Really Improve Your Investment Returns

0

By Michael Campbell

I hate getting junk mail so let me start by saying that if you’re not interested in taking advantage of the most successful investment strategy I personally use then don’t read another word – and please forgive the interruption.

If you are still reading then let me help you decide if what I am about to tell you is of interest to you. I am talking about a method I use regularly to increase the rate of return in the “solid growth and income” section of my portfolio. For example – and this is NOT a recommendation – if you wanted to increase the income from owning the Bank of Montreal common shares ($57), which currently pay a 4.8% dividend to something in the order of 8% then all you would have to do is to sell call options. At today’s prices you could sell someone the right to buy the stock from you at $60 any day until December 21, 2012. If they decide to buy it from you your annualized return would be over 15%. If they don’t buy it form you your annualized rate of return is 9% – with an opportunity to raise it further by selling another call option.

Sound confusing? Well that’s why I have agreed to do a workshop on the selling of put and call options. I don’t want to do it. It’s going to take a lot of work putting together a program that people will not only be able to understand but will also be able to implement immediately. And let me be clear, I have no problem whatsoever if you don’t want to come. I am doing this workshop to fulfill one of my own goals of doing whatever I can to help people to improve their investment performance and secure their financial future.

It kills me to talk to people or read their emails and know that they are not taking advantage of the most effective method I know to improve their investment returns. I am not talking about a short-term homerun strategy. I am talking about pushing your return up from that 2, 3, 4% range to something above 10% and more with the use of a lower risk strategy. And one I might add that the investment industry does a very poor job of utilizing.

By the way, selling calls as I have described above is only one of the strategies I’m going to explain. The other main strategy deals with selling put options with the goal of acquiring quality stocks at 10% or more below the current market price. Let me give you another quick example. Let’s say you were interested in buying gold by using the gold ETF, GLD, but you’re worried it’s going to drop further. Yet at the same time you think that over time gold is going up and you don’t want to miss the move. One way I have solved that dilemma personally – and made a lot of money – is to sell a put, which means I have sold someone the right to sell me GLD at a specific price for a specific time.

For example, as I write this GLD is selling at $1600. Right now I can sell someone the right to sell me GLD at $1600 any day up until January 18th next year and I will receive $102 per ounce. In other words if he sells me the gold my cost will be $1498 – and if he doesn’t sell it to me (because he could sell gold for more in the open market), then I keep the $102 per ounce he paid me. And I can sell another put.

Again, confusing? Well that’s why I am doing the workshop. It is a workshop that deals with improving the yield on stocks you already own and paying less for stocks you want to own. My bet is that after you attend you will say, “why the hell didn’t someone tell me about this sooner.” In my opinion they should have but because way too many in the investment business don’t use these strategies I thought I’d better do something about it.

Don’t worry if you don’t have a clue about this stuff. The workshop is going to be split in two. I am going to start with a pre-workshop seminar to teach the basics of “put” and “call” options for people who aren’t familiar with options. We’ll take a break and then I’ll start with the main workshop detailing the strategies I personally use.

I want everyone to leave with a clear understanding and being able to immediately implement the strategies if they so chose.

Anyways, you can decide if this is for you. What I can tell you is that using puts and calls in the way I will be outlining has been my most effective strategy in this market for a number of years. I have done shockingly well with it.

I think it is ridiculous that in this market environment of extreme volatility and low interest rates that you don’t have every strategy available to help you succeed but that’s up to you. You can take a couple of hours to learn these strategies or not. I just wanted to do my job and make the information available. And I can honestly say, I can’t see myself doing this again.

I wish you all the best,

Mike

PS Originally High Performance Events were going to charge $295 – and to be honest I said that it was worth a heck of a lot more. I boasted to them that I could make that money back almost immediately but I also want to make it more affordable. So I ask them to see if they could get some sponsors to offset some of the costs. Plus we donate money to Special Olympics after every event I do.

So they went out and got Disnat, McLeod Williams, Kiska Metals and the Watermark at Sechelt on board, which enables us to offer the following ticket package.

Date: May 30 , 2012
Place: Sheraton Wall Centre
Time: Per-Workshop Option Basics – 6:00 pm to 6:40 Options to Increase Your Investment Return Workshop 7:00 to 9:00 pm.
Price: $179 per ticket which includes :

• 3 free months free subscription to Money Talks exclusive Commentary Service that features a weekly comment from Michael plus exclusive contributions from Martin Armstrong, Mark Leibovit, Steve Briese, Bob Hoye, and Don Coxe.
• Unlimited access to the video recording of the event, which enables you to review everything at your leisure. This will retail for $119 but is included with the ticket.
• Plus we have arranged for follow-up seminars with Disnat further outlining how to use options. Complimentary for workshop attendees.