

Turkey’s Oil Potential: Onshore and Offshore
On the surface, Turkey has everything going for it in oil and gas. Onshore, it’s under-explored with one of the top international shale plays—the Dadas Shale—about to get tested for the first time with new technology.
Offshore there is talk of a Black Sea bonanza. The country has good governance, full-package infrastructure, easy access to markets and attractive fiscal terms.
But under the surface—in the ground, where it counts—there has yet to be a big discovery to ignite the country’s energy sector, and the share prices of the Canadian and American juniors active there.
BACKGROUND—Big Oil is All Around Turkey
Turkey’s oil production doesn’t tell much of a story. Production is less than 70,000 boe/d, and Turkey imports 90% of its oil and natural gas needs.
Nor is Turkey about proven reserves: It only has about 270 million barrels of proven oil reserves and 218 billion cubic feet of natural gas reserves, so it isn’t exactly Iraq—which borders Turkey to the southeast.

Turkey is about close-ology and a recently renewed interest by the majors in the tight oil, or shale oil—the “unconventional” stuff.
In terms of close-ology, there is:
1. To the North—Black Sea potential.
2. To the South—27 billion barrel onshore finds like Iraq’s Kirkuk field.
3. To the East—Azerbaijani oil fields.
4. To the West—well, this just gets silly. Look at this list:
a. 22+ billion barrels of oil in Greek waters in the Ionian Sea.
b. 4 billion barrels in the Greek waters of the northern Aegean Sea.
c. An estimated 7 billion cubic feet of natural gas in one well offshore the Greek-held part of Cyprus discovered late last year.
d. 33+ trillion cubic feet of gas discovered in nearby Israeli waters.
And Turkey knows how to lure investors. It offers foreign oil companies a flat 12.5% royalty tax and a 20% corporate tax rate.
Countries compete for private industry exploration dollars, and one key advantage Turkey has over competing nations—like those in the South American countries where a lot of juniors spend money—is speed in the bureaucracy.
“Approval processes are clear and rapid,” Patrick McGrath, Chief Financial Officer for Anatolia Energy Corp., told OGIB. Anatolia is exploring for the Dadas shale in southern Turkey.
Turkey has a web of pipelines, refineries and export terminals. Here, there is no question of refinery difficulty or getting product to market.
For pipelines, there is:
- The Blue Stream system transporting Russian natural gas to Turkey under the Black Sea.
- The Baku-Tbilisi-Ceyhan pipeline (the longest), which transits oil from Azerbaijan.
- Kirkuk-Ceyhan pipeline (the largest), which transits oil from northern Iraq.
- The planned Samsun-Ceyhan crude oil pipeline which will run from Turkey’s Black Sea province of Samsun to the Turkish Mediterranean hub at Ceyhan.
Six operating refineries can produce 714,275 bpd—yet there’s only 58,000 bopd of internal production. The southwestern port at Ceyhan is becoming a major regional energy hub, with several new refineries already permitted.Combine this with the most favorable financial terms in the region and the infrastructure to get oil to market, and Turkey should be an energy hotspot. It just needs a big discovery. The majors are working offshore, and majors and juniors are working onshore.OFFSHORE POTENTIAL—To the North AND to the South
State-owned Turkish Petroleum Company (TPAO) estimates there are up to 10 billion barrels recoverable in the Black Sea.
Turkey’s offshore hopes have been hit as BP’s Black Sea exploration failed to find any oil reserves in the marine regions off the northern Turkish coastline, though exploration continues. In late 2010, Chevron temporarily withdrew and a year later Exxon packed up in two areas after exploration yielded no finds.
But offshore exploration potential to the west remains attractive because of its geography: It adjoins Israeli, Cypriot and Greek waters where massive finds ALSO include:
- 232+ million barrels of oil and another 1.8 trillion cubic feet of gas discovered off Tel Aviv in March
- Turkey has also started exploratory drilling for onshore oil and gas in the Turkish north of Cyprus
This has also created some geopolitical tectonics.
Turkey has threatened war if Greece drills any further into the Aegean. And a deal struck between Israel and Greek Cyprus has Turkey worried that it will never benefit from its “share” of Cypriot gas. The Turks invaded Cyprus in 1974 and the island has since been split between the Greek zone (two-thirds) and the Turkish zone.
In early November, the Turkish authorities warned foreign oil and gas companies that they would be banned from participating in new oil and gas projects in Turkey if they cooperated with Greek Cypriot offshore drilling plans. This is a direct response to the Greek Cypriots awarding four Mediterranean Sea gas concessions.
The problem here is that the Turkish Republic of Northern Cyprus—and Turkey proper—claim the same rights to these concessions. Everyone is eyeing this Aphrodite field greedily as it sits next to Israeli waters that hold gross mean gas resources of more than 33 trillion cubic feet.
Turkey warned military action last year, but Greek-held Cyprus is supported by the United Nations, and the Turkish-held part is not recognized internationally.
– Jen Alic, guest editor
NEXT: With one of the top shale oil prospects in the world, Turkey’s potential is as big as the Barnett Shale in Texas. Geologically it’s just like the Woodford shale in Oklahoma. In Part 2, we’ll outline who is drilling this world-class play, and when investors should be paying attention.
Bakken Oil Production: Can the Giant Oil Formation Reach 1 Million Barrels a Day?
Can the Bakken produce one million barrels a day of oil?
If so, it would join an elite group of oil fields able to produce at that rate. Only six other fields, including Saudi Arabia’s famed Ghawar field, have ever topped 1 million barrels per day–they are Burgan (Kuwait), Cantarell (Mexico), Daqing (China) and Samotlor (Russia) and Kirkuk (Iraq).
The Bakken is a growth story like no other in the North American oilpatch. Less than ten years ago the Bakken was a useless resource, a pool of oil locked away in rocks too tightly packed for our technologies to penetrate. Then fracking technology unlocked America’s shale oil. Today, the Bakken is churning out more than 700,000 barrels of oil per day (bpd).
But a growing chorus of naysayers thinks the Bakken’s days of growth are numbered in North Dakota. These analysts and operators argue that wells spacing is growing too tight, making each new well less successful.
Who is right? Will the Bakken best 1 million bpd? Or is the Bakken’s biggest growth already over?
There’s no clear answer. What is clear is that the North Dakota Bakken is maturing. It’s now perforated with holes, with a well on almost every 1,280-acre unit, (in Canada, we call that two sections) and the name of the game has changed from wildcat exploration drilling to infill holes.
For the naysayers, it adds up to a Bakken story that has lost its edge. But if the optimists are right, Bakken output will climb by another 50% in the next year or two, the formation will earn historic status, and another round of investors will bank many a Bakken buck.
What Goes Up Must Come Down
The geologists with the North Dakota Department of Mineral Resources are tasked with understanding the Bakken – what has happened to the shale formation and what will happen. And their predictions tell a very interesting tale.
 This chart is from a recent department presentation. It shows three possible scenarios for the North Dakota Bakken, all of which show production doing the same thing—but peaking at very different levels.
That’s because the three forecasts describe three levels of certainty. Proven resources are barrels of oil in the ground that have a 90% chance of being economically recoverable. In other words, the black line showing the ‘proven’ future is a near certainty, one that would be derailed only if oil prices fell a lot.
The other two lines show what would happen to North Dakota’s oil output if less certain resources also end up being put into production. Probable resources have a 50% chance of being economic to recover; possible oil carries a 10% chance of being pumped to the surface.
Areas with probable or possible resources have not seen enough drilling for geologists to be sure of the geology, which leads to two types of uncertainty. First, there may be more or less oil than estimated. Second, the oil may or may not be economic to recover – especially since no one knows what the price of oil will be when the resource is eventually drilled.
If oil prices remain strong and the Bakken’s geology remains consistent through these less certain areas, operators will keep drilling new wells and North Dakota’s Bakken output should hit 1.2 million barrels per day by late 2014. This optimistic outlook means several more years of booming Bakken in North Dakota.
If oil prices tank or the Bakken reveals a geologic surprise that renders billions of barrels of probable and possible resources economically moot, output will plateau at a lower level, and sooner. In fact, if this prediction is the correct one then production has already peaked, at just above 700,000 barrels per day.
The most likely scenario, based on current information, is the one in the middle: that production will kiss 900,000 barrels per day in 2014, remain at that level for almost a decade, and then start to decline.
Whichever one happens, the message is that the North Dakota Bakken is coming close to its production peak.
“There is that point where the older wells aren’t producing as much and newer wells coming online aren’t as successful, so it does even out and production stops going up,” says Alison Ritter, public information officer with the North Dakota Department of Mineral Resources.
That being said, the North Dakota Bakken likely hasn’t reached its plateau just yet – and even when it does, the region will still be pumping a huge amount of oil for many years.
“If you think about it, two to three years is still pretty far out – we’ve still got a long ways to go as far as the drilling phase of things,” Ritter said. “It’s just that we are entering the efficiency phase, where operators are using more efficient rigs to pad drill, so there are not as many drills turning.”
Putting it into Perspective – The Backstory of the Bakken
The story of the Bakken to this point is of a technological triumph that unlocked billions of barrels of oil.
Until the advent of horizontal drilling and fracking, oil contained in shale formations like the Bakken was uneconomic. There was simply no way to access the oil trapped in those thin layers of tightly-packed rocks.
Horizontal drilling and fracking released the bounty of the Bakken. At first, oil production only inched upwards, in large part because there weren’t enough of the powerful drill rigs needed to frack a hole. But as the number of rigs increased so did the average number of fracks completed per hole, and soon production started to skyrocket.
In 2007, Bakken output averaged 75,000 barrels a day. Three years later, production had increased six-fold to 458,000 barrels of oil a day. As of September, production had hit 728,494 barrels of oil per day.
The chart above shows North Dakota Bakken production, which to date is a pretty good proxy for overall Bakken output even though the formation reaches beyond that state’s borders.
Three Challenges
There are three main challenges for the Bakken to reach oil production of 1,000,000 bopd:
1. How much oil can be recovered
2. Can the Bakken overcome steep decline curves
3. The Bakken becomes a victim of its own success—in both geology and economics
There truly is still an immense amount of oil in the Bakken. Original oil in place (OOIP) for the formation stands somewhere between 200 and 400 billion barrels, and production since 1953 adds up to just 503 million barrels.
OOIP is interesting, but what really matters is the amount of oil that can be recovered. If you want to get to 1,000,000 bopd production, you must recover a lot of that oil. The older style, pre-shale, conventional reservoirs have recoveries of near 30% (that’s called the Recovery Factor, or RF) of OOIP.
But in tight reservoirs like the Bakken, the Recovery Factor drops below 10%.
In 2008 the US Geological Survey estimated the Bakken contained 3 to 4.5 billion barrels of “technically recoverable” oil. Soon after the North Dakota Geological Survey came out with a much higher number: 11 billion barrels. For its part, Bakken pioneer Continental Resources (CLR-NYSE) pegged the formation’s recoverable resources at 24 billion barrels.
Whatever the number, it is important to remember that technically recoverable is not the same as economically recoverable. An area with very low recovery rates might host technically recoverable oil, but oil seekers aren’t going to spend millions of dollars on a well that will only produce a trickle of oil.
And a Bakken well that starts with a trickle is bad news, because in shale deposits well outputs decline rapidly – along the lines of 40% year-over-year for the first few years.
Wells in conventional oil fields usually decline in a much more gradual manner:
The third challenge is starting to become more apparent right now. In trying to reach 1 million bopd, the Bakken could be a victim of its own success. The Bakken boom took off so quickly that infrastructure could not keep pace, and now there isn’t enough pipeline capacity to move oil from the Bakken to America’s refineries–on the Gulf, east or west coasts.
The result: Bakken oil is piling up in the storage hub in Cushing, Oklahoma. Basic economics say a glut of supply means lower prices – a heavy burden in a place where wells are unusually expensive.
A vertical well into a conventional oil field costs something like $1 million. The Bakken’s horizontal, multi-stage frack wells cost an average of $9 million, according to the North Dakota Department of Mineral Resources.
That’s a huge upfront cost. Each well produces approximately 615,000 barrels of oil, meaning the breakeven price for each Bakken well ends up in the $70-$90/barrel range, once taxes, royalties, and expenses are included. If oil prices slump below that level, a lot of people say Bakken wells aren’t worth the cost.
As the wells in the Bakken grow closer together, initial production rates are sliding. According to some sets of data, average first year well output climbed steadily from 2005 to a peak in mid-2010, then declined almost 25% over the following 12 months.
With more wells tapping into the same resources, there is simply less oil pressure available to each well. And when initial well output starts to fall, an accelerating number of new wells must be brought online to sustain overall production volumes.
Such is the heart of the pessimist argument: that sliding initial flow rates will tag-team with the Bakken’s high decline rates to mean that, no matter how many new wells are drilled, production will stagnate.
Then there are the crowds of optimists who still see many bright days ahead for the North Dakota Bakken. One of those optimists is oil and gas writer Michael Filloon. Filloon says the naysayers are wrong because they generally fail to consider a slew of factors that impact the economic success of a Bakken well, including increasingly effective frac techniques, longer lateral wells, revenues from the sale of byproduct natural gas and natural gas liquids, and cost savings from the shift to pad drilling. (I really enjoy Michael’s articles—if you’re a serious Bakken investor you should read his articles at www.seekingalpha.com)
CONCLUSION – Production Plateau Is Coming Soon
Exactly when and at what level Bakken output plateaus, one thing is clear: the Bakken is a national treasure. North Dakota is now second only to Texas in terms of state oil production. By 2035, the US Energy Information Administration thinks shale oil could account for as much as a third of US oil production and believes North Dakota alone will contribute 10% of America’s oil needs.
That’s impressive by any measure.
While it’s too early to say if the Bakken can produce 1,000,000 barrels of oil per day, the reality is we should know in the next 2-3 years. Bakken production does best 1 million bpd it will join an elite group of oil fields able to produce at that rate. Only six other fields, including Ghawar, have ever topped 1 million barrels per day.
Even at its current level near 730,000 bpd, the Bakken is a formidable discovery. It has significantly enhanced America’s energy security and generated incredible wealth for investors, landowners, North Dakotans, and state and federal governments. And North Dakota’s Bakken will continue to pump impressive volumes of light, sweet oil for many years.
But whether in a year or three, and whether after reaching that million-barrel mark or not, North Dakota’s Bakken boom will soon plateau. That, my friends, is simply the nature of resource extraction – the Bakken bounty just can’t last forever.
The Montana Bakken Oil Play: “Great News for a Great Play”
Activity in the huge Bakken field is going home.
Home is Montana, where the Bakken was originally discovered.
Drilling equipment and crews are moving back across the border from North Dakota—where the Bakken Boom has been the Biggest—boosting Montana’s rig count to 22 from just eight at this time last year. Montana’s Department of Natural Resources and Conservation issued a record 356 oil drilling permits in the first ten months of the year, easily beating the previous record of 313 set in 2005.

Note the declining rig count in North Dakota (blue line) contrasted with the rising count in Montana (red line).
Thanks to the Federal Reserve Bank of Minneapolis for the figure.
Thanks to the Federal Reserve Bank of Minneapolis for the figure.
In October a Texas company paid $13.5 million for 75,000 acres of oil and gas leases, one of the largest federal lease acquisitions by a single company in Montana in recent years. Several other companies, including Bakken leader Continental, are working to expand the boundaries of the state’s most productive Bakken field, known as Elm Coulee.
Investors often forget that the first successful horizontal well drilled into the Bakken was drilled into the Elm Coulee field in Montana, drilled by Lyco Energy Corp in 2000. There were earlier wells, even horizontal ones, but this 2000 Lyco well is widely cited as the first successful one. (For more, check out this a cool timeline of the Bakken here: http://www.undeerc.org/bakken/pdfs/BakkenTimeline2.pdf)
But geology doesn’t pay attention to state lines… and even though the Bakken boom started with a few good wells in Montana, attention shifted next door after operators decided the geology in North Dakota offered more potential.
There is still an immense amount of oil in the Bakken, which means investors can still find ways to profit from this fantastic formation. But instead of coming late to the North Dakota Bakken party, where six years of profits have left slim pickings, a more savvy choice might be to check out the new scene next door.

BACKGROUND – WHY THE BAKKEN MOVED TO NORTH DAKOTA
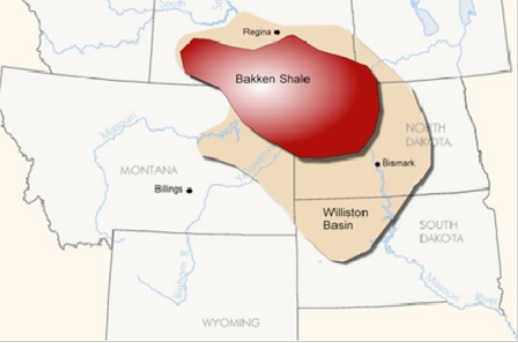
The Bakken is a 200,000-square mile rock unit within the even larger Williston Basin, an ancient inland sea that reaches from southern Saskatchewan to North Dakota and eastern Montana. The Bakken therefore touches four states and provinces, and in the early days of the Bakken boom – way back in 2006 – drilling was fairly evenly split between North Dakota and Montana.
So why did North Dakotans get all the fun? Because of geology.
The Bakken is generally divided into three stacked layers—Upper, Middle and Lower. The upper and lower layers are organic-rich black shales that gave birth to the formation’s oil. The industry calls those layers “source rocks”. The middle layer is made up of more porous rocks—which also means more holes and less pressure in those rocks—so the oil seeped away from those higher pressure, denser layers, looking to a more porous resting place. The industry calls that the reservoir. And the oil is stuck there in the middle Bakken reservoir.
That’s why the Middle Bakken generates the best production volumes…and the Middle Bakken is thickest in North Dakota. In the early days of the Bakken boom, a couple high-volume wells tapped into the Middle Bakken drew almost all of the attention to North Dakota.
————————————-
“NO OIL LEFT BEHIND”
Did you know that today’s primary oil recovery methods can leave up to 90% of a formation’s oil trapped in the ground?The industry calls this “stranded oil.” For oil producers, it can mean millions of dollars left on the table.Fortunately for them there’s now a technology that can actually produce all this stranded oil… quickly and effectively, with no environmental footprint.In fact it is proven to extend the field life – the lifeblood– of oil fields throughout the world… including today’s massive new shale formations. (This company’s patented technology is being used successfully by clients on 3 continents.)What’s more – with over 200,000 wells in the world that could (and should) use this technology, it could mean an absolute windfall for investors.
Click here to get caught up on the whole story.
————————————-
Those few gushing wells in North Dakota sparked a land grab there. Then, because North Dakota requires mineral lease holders to explore their acreages within three years, companies with ground in North Dakota had to spend their money there.
And so North Dakota became the Bakken boom ground, with a rig count that climbed from 25 in 2005 to 213 in mid-2012. Meanwhile Montana was largely forgotten, even though the heart of the formation extends across state lines.
BAKKEN MOVING HOME TO MONTANA NOW
Now that is starting to change. In recent months, the Montana Bakken has started to steal some of the spotlight.
Helping the move is new data showing that geology may be less of an obstacle in Montana than originally thought.
Remember, North Dakota produced those gushing Bakken wells because the primary reservoir layer, the Middle Bakken, is thickest within its portion of the Bakken.
In Montana the middle layer is thinner, pinched by the Upper and Lower Bakken layers, and geologists thought a thin Middle Bakken would translate into poor recoveries and flow rates.
But recently, several explorers have had success with wells that targeted the Upper Bakken. The wells don’t have the big initial flow rates as in North Dakota, but they declined more slowly and had a better oil-to-gas ratios (98% oil) than normal, Middle Bakken wells. The result is making geologists rethink the potential of the Upper Bakken – and therefore the potential of the entire Montana Bakken.
A productive Upper Bakken is particularly significant in Elm Coulee, the best-producing part of the Montana Bakken to date. In this area the Middle Bakken becomes very thin, pinched out by a broad Upper Bakken. The result is a world-class source rock – remember that the organic-rich Upper Bakken is the source rock for the formation’s oil – with no nearby reservoir. That means all the oil has remained in place.
Colorado School of Mines professor Steve Sonnenberg pushed the potential of the Upper Bakken in a recent article, saying these results from the Upper Bakken represent “great news for a great play.”
Jim Halverson, a geologist with the Montana Board of Oil and Gas, is cautiously optimistic about the potential for a Montana Bakken boom.
“We’ve got lots of rigs, there’s lots of stuff going on right now,” he said in an interview. “And we’ve got a fair amount of development that’s targeting the upper shale.”
However, Halverson is not letting himself get carried away with dreams of a major Montana Bakken boom.
“Here in Montana we’re going to have the western edge of the Bakken,” he said. “That edge is going to be economic. We will have good wells, then less good wells, then wells that are uneconomic – the price of oil is going to be critical.”
That being said, Halverson also spoke to the possibility that drills might hit into something unexpected – and exciting. Sometimes drills “…find things you weren’t looking for, so just getting more wells drilled here is a good thing. Maybe a year from now we’ll all be doing something we never thought we were going to be doing.”
Next Story: Can the mighty Bakken reach 1 million barrels a day production… OR is the boom soon to plateau?
")
MANY NEW UTILITY CONTRACTS MAKE THIS A TANTALIZING STOCK COMPANY ANALYSIS...
The junior tech market is getting serious love from investors--finally! Positive cash flow among Canadian small caps meant nothing for years until about early...


 THE ONLY COMPANY TO REVERSE LATE STAGE LIVER DISEASE WHAT’S THAT WORTH?")
")