Oil and Gas “Tax Pools” – A Little-Known Investor Strategy

0


In Part 1 of my series on tax pools, I explained how the new dividend-paying junior producers will use up their tax shelters by drilling less—crimping cash flow much sooner than expected.

In this article, I create a “tax pool universe” to help investors discover:

1. which companies have big tax pools that will keep the taxman away
2. which ones are being pushed to the brink of taxability—where a big chunk of cash flow is suddenly vaporized
3. how you can find this information for yourself, making you a better investor

Below, I use the companies in the BMO Nesbitt Burns coverage universe that have reported their current tax pools (not everyone does), and then measure this against corporate cash flows (annualized for the 2012 calendar year).

On the horizontal axis is total tax pools for all E&Ps that have reported. On the vertical axis is their cash flows—annualized for those companies that have not yet reported their Q4 financials.

There are different kinds of tax pools. Some more valuable than others, because a greater portion can be written off against income immediately, rather than drawing out the deductions over several years.

For this analysis, I look at total tax pools—because many companies only report their total, without breaking it down into different types. This metric still gives a useful picture of who has enough credits to shelter income for the coming years, and who is going to get hit with a stiff tax bill soon.

(The closer to the bottom right in the chart—the better for preserving tax pools.)

Tax Pool Universe Chart

A few things jump out from the analysis.

The oldest and largest companies have generated the largest tax pools (plotting further right on the chart)—because they’ve drilled a lot of wells over their lifetimes.

Enerplus (TSX:ERF) and ARC Resources (TSX:ARX) top the list for total tax pools, holding just under $3.5 billion and $2.5 billion in pools, respectively.

Peyto (TSX:PEY) also holds significant pools, at around $1.3 billion.

Smaller firms range between about $50 million and $850 million in pools. Whitecap Resources (TSX:WCP) is at the top end of this range. Twoco Petroleums (TSXV:TWO) is at the lower end.

This is a big spread for tax pools across the space. Interestingly, these companies all have a much tighter range of cash flows, from about $25 million (Southern Pacific—TSX:STP) to $130 million (Twin Butte—TSX:TBE).

That means some of these smaller companies have very large tax pools relative to cash flow—enough to shelter income for several years. Whitecap is a good example. But we see that others are running on tax-pool fumes, such as Raging River (TSXV:RRX).

One anomaly on the chart is Athabasca Oil (TSX:ATH). The company has large tax pools of just under $1.7 billion. That’s because of large amounts of cash spent on setting up its capital-intensive oil sands operations.

But the long development horizon on these projects means Athabasca isn’t yet making any money—making the company a tax pool bank that just keeps accumulating credits.

The Cover Ratio

Another way of looking at our universe is the “cover ratio.”

That’s a company’s total tax pools divided by yearly cash flow. In other words—how many years tax credits can shield income at current production rates and netbacks.

taxpoolstocashflow

Companies with a high ratio like Southern Pacific, Anderson (T:AXL), Arcan (TSXV:ARN) and Whitecap (TSX:WCP) have the most “covered” cash flows. (Twoco Petroleums is excluded from the chart. The company has an extremely high ratio by virtue of its very low annualized cash flow of just under $400,000—part of the reason the company just received a $19.55 million demand note from its lenders.)

Those with low cover ratios can only shield their cash flows for a short time before taxes kick in. For Raging River the ratio is only 1.8. ARC Resources is also at the low end, at 2.5. Despite that company’s large tax pools, it cash flows nearly a billion dollars annualized.

This metric is revealing. Consider ARC and Enerplus—two companies widely regarded as comparable “elder statesmen” of the Canadian oil patch.

Both produce considerable cash flows and dividends for investors. But Enerplus enjoys double the cover ratio of ARC, at 5.1.

The analysis also shows that companies like Bonterra (TSX:BNE), BlackPearl (TSX:PXX) and Angle Energy (TSX:NGL) enjoy very comfortable cover ratios. Investors buying these firms should be free from a sudden visit by the taxman.

Be Tax Aware

Unfortunately, tax pool information is not required in standard TSX company financial statements or MD&As. Investors may find numbers from select companies in such documents (search “tax pools” in your PDF search function for a quick look), or in Annual Information Forms (available on SEDAR).

For companies that don’t report numbers in any of these, a phone call is necessary. Ask management about their total tax pool holdings. Better still if they can break that amount down into Canadian Exploration Expenses (which can be used 100% in a given year) and Canadian Development Expenses (where only 30% can be used each year).

In the new “growth and dividend” E&P world, these things are critical to note for investors. Stock-buyers may find companies with unrecognized tax-pool value. Look for those firms that have high cover ratios—big tax pools relative to their cash flows.

Equally, beware (or at least be aware) of companies with small and shrinking tax pools. These companies will “gear down” in cash flow when they start paying taxes. Lower spending = lower production = lower valuation.

For such firms, the question is, “Would I buy this stock if its cash flow suddenly dropped 20%?”

If the answer is no—and the tax pools are tight—stay away.

– Dave Forest, Guest Editor

Publisher Note: In Dave’s next–and final–story (part 3), he’ll show you how this little-known but all important tax pool metric could start driving M&A activity in the oilpatch–and who the most likely targets are.

Read Part 1 here.

Sizing Up Today’s Dividend Paying Exploration & Production (E&P) Companies

0


One question investors should be asking about new dividend-focused E&P companies in the Canadian oil patch is:

How will they pay their taxes?

Deferring income tax payments is a major part of the business strategy for most junior E&Ps—one that investors don’t realize. Investors have become so used to junior producers (almost) never paying taxes, it’s hard to imagine how paying taxes could affect valuations (read: stock prices).

Oil and gas companies typically build up “tax pools”—credits that can be claimed against income—as a result of their capital spending programs, on drilling wells and building facilities.

But income-focused E&Ps are today slowing their capital spending programs, choosing to divert more cash flow into dividends and less into drilling. Whitecap Resources (TSXV:WCP) for example, announced it will reduce capital spending to approximately 63% of cash flow.

Lower capital spending means these companies generate fewer tax pools. Companies pay more tax, sooner—reducing cash flow. Valuations—as a multiple of cash flow, and net present value of in-ground oil and gas reserves—then decline, meaning lower share prices.

A hypothetical example goes like this: ABC Oil cash-flows $100 million per year—entirely tax-sheltered by its tax pools. It trades at a five-times multiple valuation of $500 million. The company has 100 million shares out, so enjoys a $5 stock price.

But now drilling slows, and tax pools are used up. ABC’s $100 million cash flow now becomes taxable—$25 million is lost to the government (Alberta’s all-in corporate tax is about 25%). Earnings drop to $75 million yearly, and the valuation slides to $375 million. The share price falls to $3.75.

This is potentially a big deal, especially for smaller companies: many E&Ps have avoided paying taxes completely over the last several years because of their spending-driven tax credits.

 ————————————————————

What Used To Cost $100 Million… Now Runs Just $13 Million

That’s the immediate “before and after” result of using my new top pick’s proprietary oil exploration technology — as reported recently by the head of a large international oil company.

This cutting-edge technology fast tracks the exploration of the world’s oil and gas, saving producers millions of dollars,
and years of work.

The upside for investors? Read my breaking research on this play here.

————————————————————

Whitecap stated in its last annual information form that management did not expect the company to be taxable until 2015. Renegade Petroleum (TSXV:RPL)—also an announced converter to the income model—estimated it wouldn’t become taxable until late 2013 or early 2014.

Deferring taxes helps these companies in a few ways. First and foremost it boosts their available cash flow, giving them greater scope for exploration work, and property or corporate acquisitions.

Deferred taxes also affect the net present value for an E&P’s in-ground oil and gas reserves as reported every year. Companies show values for their un-pumped petroleum in two ways: the before-tax value and the after-tax value.

Deducting cash flow for taxes reduces the after-tax NPV (the number most analysts look at)—all the more so on a percentage basis, when taxes kick in during nearer years that carry higher, less-discounted values.

Some analysts even believe that small E&Ps are unviable after they become taxable—as a start-up you need that extra ooomph in cash flow in order to establish company-building fields.

The drive to stay sheltered from taxes even led to a movement (largely done with now) to re-structure failed technology companies into junior E&Ps in order to take advantage of huge, transferable R&D tax credits racked up by these companies. Trafalgar Energy, which later became Midway Energy—acquired last year by Whitecap—was one such restructured “tax-loss” company.

Exploration Versus Development

Tax credits applicable to E&Ps come in several forms. The most important are:

• Canadian Exploration Expenses—costs associated with drilling and completing wells on unproven exploration targets (100% deductible annually)

• Canadian Development Expenses—expenses on infill or enhancement drilling at established fields (30% deductible annually)

• Undepreciated capital costs—deductible at around 25% annually for most companies

• Canadian oil and gas property expenses—deductible at 10% annually

Drilling represents the major portion of capital expenditures for most junior E&Ps, who tend to spend less money on pipelines and major facilities. Start-up companies usually generate drilling-related annual tax pools quickly in the beginning, as they drill exploration wells that carry 100% annual write-offs.

Once companies make discoveries, they drill fewer exploration holes. Drilling now focuses on development wells that carry only 30% write-offs. This usually leads to slower generation of tax pools—although development drilling tax credits are still significant because development programs are carried out on a larger scale. Meaning higher overall costs, compared to exploration drilling.

During this critical shift from exploration to development, changes in capital spending greatly affect tax pools.

Compare Renegade Petroleum—which announced a switch to the dividend model early in 2012—with Whitecap Resources, which remained in spend-and-grow mode during most of the year.

In 2011, both companies were in growth mode. Renegade’s Canadian development tax pools grew by 109%, with Whitecap’s increasing by an even-larger 185%.

But in 2012 (up to last financials in Q3), Renegade’s shifting strategy saw its development tax pool growth slowed to 41%. A natural consequence of the income-and-growth model, because the company claimed some of its existing tax pools against cash flow. But Whitecap’s tax pool growth continued apace, up 186%.

Whitecap will now cut spending as it switches to the income model. Drilling will slow, and so will tax pool growth. Like Renegade, WCP will have fewer tax credits to claim.

The Taxman Cometh

The question is: how soon will these companies have to start paying tax?

As of the end of Q3 2012, Whitecap held up to $195 million in tax pools available for the current year. The company cash-flowed approximately $130 million through the first three quarters of 2012—meaning its annualized funds from operations should come in lower than its available tax pools, sheltering all this money.

Renegade is in a similar boat, with up to $59 million in tax pools available for use this year (as of the end of Q3 2012), against cash flow so far in 2012 of just over $44 million. They too should come in un-taxable.

But there’s not a lot of room to breathe. When companies spend less, they generate tax pools slower. They become taxable sooner.

That’s exactly what’s happening. Renegade announced mid-January that its capital spending for 2013 will drop to just under $80 million—27% less than the $110 million RPL spent in the first nine months of 2012. Both companies look like they could come up against taxability in 2013 or 2014.

For Renegade that’s in line with management announcements. For Whitecap, it would be sooner than the company forecast last year (management will put out updated estimates in the next few months).

Earlier tax would obviously pinch cash flow… meaning a lower stock price and after-tax value of reserves.

Tax-Driven Consolidation and M&A

Investors need to look for management teams that recognize the tax issue. Ones prepared to deal with it. “We discuss it for sure,” says Renegade Controller Mark Lobello.

What can companies do? One solution could be increased M&A. Acquiring not only production and reserves, but also tax pools from companies that have spent large amounts on drilling.

Whitecap, for example, gained tax pools when it acquired Midway Energy in the second quarter of 2012. During that quarter—largely as a result of the acquisition—Whitecap’s tax pools grew by $318 million… including over $143 million in critical Canadian Development Expenses.

This adds as much as $75 million in pools applicable this year—helping to shelter about 50% of WCP’s cash flow.

Renegade also looks at M&A with tax pool-rich companies as an answer, according to Lobello. “We’re always looking at tax-loss acquisitions,” he notes.

E&Ps staring down taxability may look to acquire or merge with firms holding significant tax pools. Ironically, the preferred targets would be companies that have under-performed:  those that drilled a lot, but failed to cash flow enough to eat up tax pools. Such companies often trade at reduced multiples, making them even more attractive as targets.

Whitecap’s acquisition of Midway is a good example. Without Midway’s tax pools, WCP would have been close to taxable in 2012. That would have meant a sudden, unexpected fall in cash flow—the kind that causes analysts and investors to lower target prices and sell off a stock.

Such negative revisions will be reality in the new income-focused E&P sector. Investors need to check tax pools against cash flow—to see who is safe and who is in danger of an unexpected tax-driven bite out of profits.

– Dave Forest

Read Part 2 here and Part 3 here.

Drilling Efficiency: Lowering the Break-even Price of Natural Gas

0


Natural gas bulls keep pointing to the declining gas rig count in the US as a reason for a near-term turnaround to the upside in prices.

The gas rig count in the US has dropped by more than half in the last 18 months, but production continues at record levels—around 63-64 billion cubic feet per day (bcf/d). Why is that?

First, the stats: The February 15 Baker Hughes rig count—the Bible of the industry—showed the gas rig count at 421, the fifth-lowest in the current run down—that’s down from 1,600 in 2008, or almost a 75% drop. Just this last year the gas rig count has dropped 41%.


rotary-rig-count
(You can find this chart each week at http://intelligencepress.com/features/bakerhughes).

There are two obvious reasons for this—one is that there is more “associated gas” with oil production, especially in Texas (not so much in North Dakota on a per well basis, but overall the Bakken is up around 1 bcf/d in gas now).

But the big reason is drilling efficiency. When I go to conferences, I tell the crowd—fracking isn’t improving every year. It’s not improving every quarter. It’s improving every month. That shows up in the reduced time it takes to drill a well now, thanks to improvements in horizontal drilling techniques, and in the amount of gas each well is able get out of the formation—thanks to improvements in hydraulic fracturing.

The problem is, few companies want to brag about how much they’re improving production, so hard statistics are hard to come by.

In one of his blog posts last year, industry expert Rusty Braziel of RBN Energy published some statistics from Southwestern Energy, which provided in-depth numbers on its drilling operations in the Fayetteville shale in Arkansas and Oklahoma.

Over the course of five years, the company’s average drilling time per well plunged from 17 days in 2007 to only 8 days in 2011, falling by more than half. In just one year from 2010 to 2011, drilling time dropped more than 27 percent. Over the same five-year period, the later length of wells grew by 82 percent, and initial production more than doubled, rising from 1.65 million cubic feet per day in 2007 to 3.3 million cubic feet per day in 2011.

All the while, the cost per well hovered around the same level, dipping 4 percent from 2007 levels.

So for the same costs, drilling rigs were producing more than twice as many wells, with more than double the initial production. That means the initial production additions per rig grew by 338 percent in half a decade. If the rest of the energy industry saw the same kinds of improvement over the same period, even while cutting rig counts by three-quarters from their 2008 peak, we would expect to see a modest rise in production from simple efficiency.

These changes are not just coming over the course of years, either. Southwestern reported huge swings in IP rates even from quarter to quarter. Between the first and second quarters of 2009, average IP rates at the company’s wells rose 20.7 percent, and eight quarters out of five years saw an increase of at least 13.4 percent.

And other companies have seen comparable improvements. As recently as the third quarter of 2012, exploration giant Anadarko reported a 14 percent year-over-year reduction in drilling costs, along with a 40 percent drop in completion time at its Marcellus operations.

Future of Oil and Gas Goes Through Efficiency

Others are not only pointing out drilling efficiencies, but say they will continue into the future. A report released last summer from Credit Suisse hinged its estimates of future American oil production on expected improvements in efficiency.

Credit Suisse estimates that that drilling and completion times will fall by around 40 percent within the next decade as exploration companies become more familiar with new technology and new geology. Some of the newest emerging plays, particularly in California, would come closer to a 50 percent reduction.

That amounts to a less dramatic improvement than that observed by Southwestern over the past five years, but it would still allow energy firms to increase well counts by 27 percent by 2016 with only an 11 percent rise in rig counts.

The report also assumes steadily improving initial production, a trend that has already been observed in shale developments in North Dakota. Credit Suisse sees IP rates rising 21 percent over the numbers seen at the end of 2011.

As positive as these numbers sound, Reuters reports that consulting firm Bernstein Research points out the obvious other side of the coin—efficiency is improving dramatically because fracking operations at present are highly inefficient.

The firm released research last year suggesting that as many as half of all fracking stages contribute no additional production from a given well. In turn, the vast majority of all production – 80 percent – comes from only 20 percent of all fracking stages; yet another example of the somewhat infamous Pareto principle, commonly known as the 80/20 rule.

Nansen Saleri, president and CEO of consulting firm Quantum Reservoir Impact, told the news source: “In a few years the techniques used today for fracking will be viewed as primitive.”

So as investors watch the gas rig count with a perplexed face, the industry has been steadily reducing the cost of drilling, lowering the break-even price of natural gas—and disappointing the bulls.

by +Keith Schaefer

Refinery Stocks: What I’m Buying Right Now

0

Dear OGIB Reader,

There is a definite seasonality to the oil and gas stocks in Canada—and generally speaking, the top is right now.

In both 2011 and 2012, the TSX Energy Index peaked out the first week of February. In 2010 it was the first week of January.

tsx energy index

Each of the last two years, the March-June timeframe gave investors serious downturns—the juniors as a group dropped by roughly 50%. It’s tough (for me anyway) to hold stocks in those kinds of corrections.

It’s my job to help subscribers find the best ways to make money in oil and gas. Sometimes it’s the junior producers, which have given me some great wins—DeeThree and Coastal Energy now, and TAG Oil last year.

That’s sometimes–but now is not that time. Despite strong oil prices, Canadian junior producers are getting no love from Big Money—institutions. Part of the reason is the big discounts the producers are being forced into due to lack of pipelines (for heavy oil) and refineries (for light oil).

Another big part of the reason is that the market now understands the tight oil plays don’t recycle cash fast enough for juniors—only a very few management teams are able to do that, and NOT have to go to market for dilutive financings every year.

Natural gas prices continue to languish, and Natural Gas Liquids pricing has also gone way down (except for condensate).
Also, oil is now in what I call the “no-win” price range for junior producers. The stocks of these juniors do the best when oil is at the BOTTOM of its trading range—usually around WTI $75-$85/barrel. Then traders know a rising tide will lift all boats, and the junior stocks get love—and bids.

But now, Brent oil is $119/bbl and WTI is just over $97. Since 2008, history is clear: oil juniors have an INVERSE relationship with oil prices when Brent gets above $120/bbl.

That’s because the market starts to price in lower global growth, if not outright recession.

And one of the first things the market does then is sell the riskiest assets; i.e. junior stocks of all kind.

So at $120 Brent, it’s hard for investors in junior stocks to win—if oil goes up, these stocks go down as the market prices in recession.

If oil goes down, these stocks go down, as the market prices in lower cash flow.

What this really means for me right now is that—I’m much more likely to sell any junior that I don’t LOVE, in the near term. Or at least reduce it.

And if it’s got a good chart, I’ll keep it. But make no mistake, even my favourites are vulnerable. If a stock chart cracks more than 20% off its recent highs, I’m likely a seller and I wait on the sidelines.

I read a stat once that stuck with me—80% of all stocks trade with the market; they go up and down with the tide.

And while the tide might be coming into equities now, they don’t appear to be moving into junior oil stocks.

That’s why I’m moving into stocks that process commodities—water, oil and ethanol for example—to make money in the energy space in 2013.

There is always a bull market somewhere in energy, and that is especially true in the energy markets. In September 2012 I started buying select US refinery stocks, and it has become the biggest part of my OGIB subscriber portfolio.

They get to buy low-priced Canadian oil, and my attitude is—don’t get mad, get even. Buy the refinery stocks.

As I explained in my September article, The Mystery Behind High North American Gas Prices, these companies get to buy cheap North American crude and sell their refined products at much higher Brent-based pricing—which is still $20/barrel higher right now than WTI, despite the Seaway pipeline expansion.

I also talked about this on FOX-TV in the US — you can see that on the OGIB web site’s Media page, video # 2.

It’s not just refineries. It’s also logistics companies, oilsands services companies, water companies, and others.

But it’s the refineries that are cash machines right now, and that’s where I want my money. There’s one I think will benefit more than any other — because of its unique location, its high cash flow and dividend, and because it’s a well-diversified business. Keep reading here for more on this cash-churning play.

by +Keith Schaefer

An Unexpected Surge in U.S. Condensate Production: From Eagle Ford to Canada

0

Investing in Condensate, Part I  explained what this hot new commodity is; Part II outlined the bullish case for Canadian condensate demand, and in this third and final article on condensate, I review American efforts to move their glut of condensate north.

Condensate is making uneconomic gas wells profitable for producers in the shale basins of northern BC and Alberta, and creating some great investment opportunities for informed investors.

The reason condensate is king in Canada is that oil sands producers need piles of this light oil to dilute their heavy bitumen for transport, and Canadian production can’t keep up with demand.

How long can this party last? Shale oil and gas basins in the United States are churning out condensate, where demand is very limited. A glut is developing.

That glut is needed up north, so infrastructure players are busy planning, permitting, and building pipelines to move America’s piles of condensate to the Canadian oil sands producers that need it. Once that happens, will condensate’s Canadian price premium evaporate?

It’s an important question, as strong condensate prices are the only leg many Canadian gas producers have to stand on right now.

America’s Unexpected Condensate Wealth

The Shale Revolution has transformed America’s energy scene. After decades of decline, US oil production is again on the rise. The turnaround has been even more dramatic on the natural gas front: shale wealth has transformed the country from an importer to an exporter and pushed prices to historic lows.

Condensate production is an unexpected sideshow of the shale phenomenon – but it is starting to steal some of the limelight because shale wells are producing just so much of it.

Take the Eagle Ford shale basin, which stretches across much of south and east Texas. The basin’s tight sedimentary rocks contain a range of hydrocarbons: wells on the southeastern flank generally produce dry gas, wells in the middle produce gas, natural gas liquids (NGLs), and condensate, and wells to the northwest generate oil and condensate.Eagle Ford producers drilled their wells looking for oil or gas. Condensate was an unexpected bonus – but it now makes up as much as 40% of the hydrocarbons produced from the formation.

Forecasters predict that total Eagle Ford oil output will reach 500,000 to 800,000 barrels per day (bpd) by 2020. A large number of those barrels – somewhere between 250,000 and 400,000 bpd – will be condensate. Compare that to 2011, when condensate production from the formation averaged 130,000 barrels per day.

It means condensate production from Eagle Ford will likely grow by 150% in less than a decade. And Eagle Ford is just one of a slew of shale basins being drilled and fracked apace in the United States to produce oil, natural gas, NGLs, and condensate.

It sounds great, right? Not only are shale basins producing the natural gas and crude oil expected, they are also churning out piles of condensate, a hydrocarbon mixture so light you could often pour it straight into your tractor. Condensate must be making US shale producers happy, right?

Wrong.

Condensate and US Refineries – A Poor Match

Since it is produced alongside oil and since it is in fact oil, producers lump condensate with oil when reporting production volumes. As a result, it seems like US oil production is shooting through the roof. But while domestic output is certainly rising, lumping condensate in with crude is misleading because not every hydrocarbon molecule is created equal – especially through the eyes of a refinery.

Half of America’s refineries lie along the Gulf Coast. With the ability to process 8 million barrels of crude oil every day, this industrial complex truly sets the tone for oil pricing across the country. And guess what? Gulf Coast refineries don’t like condensate.

————————————

What Is This “Freak of Nature” Gas Play?

In short, it has the best economics of any pure gas play I’ve ever seen in my life.

And in this new briefing, I take you through, point by point, why I think this one natural gas stock,

a pure play on gas, could be the single best trade in the sector – junior, intermediate or senior.

Keep reading here to learn more…

————————————-

Refineries are picky beasts, each one only able to process crudes within a particular API range. The Gulf Coast army of refineries used to love light oil, but over the last 25 years the world burned through many of its high-quality deposits of light crude. That forced producers to shift towards heavier and sourer crudes.

In response, US refineries invested billions in upgrades to be able to process these more complicated crudes. In fact, from 2005 to 2009 the US refining industry spent $47.6 billion on heavy oil upgrades.

Then came the Shale Revolution. Fracking technology is the engine for America’s drive for increased energy independence.  Suddenly producers were pumping good quality oil from shale basins across the continent.The refineries can handle shale oil. They cannot, however, handle much condensate.

The only way to feed condensate into these medium and heavy oil refineries is to mix the light oil with a heavier crude, to produce a mid-weight blend. But even that is not ideal, because it turns out a mixture of heavy oil and condensate does not produce the same products as a straight crude of similar weight.

Specifically, a mixture of light condensate and heavy crude produces lots of very light products, such as naphtha, and little to none of the heavier and more valuable distillates used to make diesel and jet fuel.

So, since a crude-condensate blend produces less valuable products than a straight crude of the same average weight, refiners discount the price they’re willing to pay for blends.

The unexpected surge in condensate production has collided head-on with low demand from US refineries, resulting in poor pricing. In general, Gulf Coast crude marketers have been paying about $15 per barrel less for condensate than for the light crude it is produced alongside.

Since it is cheaper than crude, refineries are buying some condensate and mixing it with heavier crudes for processing. The products are worth less but input costs are also lower, so it works out ok for refiners’ bottom lines.

It does not, however, work out well for producers. Shale producers invest millions of dollars into each multi-stage frac well. They don’t want to sell half their production at a discount – they want buyers who are willing to pay top dollar for all this light, sweet condensate.

Those buyers, as we learned last week, are north of the 49th parallel.

Getting Condensate to Canada

Canada needs condensate. US producers are flooded with the stuff and want to sell it to Canadian oil sands operators. The challenge is moving it.

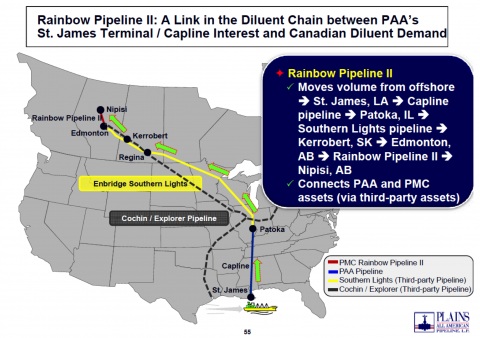
The only pipeline currently moving condensate from the US into Canada is Enbridge’s Southern Lights line, which runs from Illinois to Edmonton. It can move 180,000 barrels per day, which can more than handle the 110,000 bpd of condensate being imported now and Enbridge is proposing an expansion.

 rainbow pipeline


The hard part, the bottleneck, is getting it to Patoka, where it can enter Southern Lights. Patoka, it turns out, is not particularly close to the biggest condensate-producing shale in the US, which is the Eagle Ford basin in Texas.

There are ways. For example, Plains All American is using the Louisiana port of St James as a staging post to route Eagle Ford condensate into the Capline pipeline for shipment to Patoka.

Others are using existing gathering networks to move condensate to Corpus Christi on the Texas Gulf Coast, where it is loaded onto barges and transported to St James. Magellan Midstream Partners and Copano Energy are taking this one step further, extending one of Copano’s pipes by 140 miles to Corpus Christi. That line should soon be moving 100,000 barrels of condensate a day.

KINDER MORGAN’S PLANS

Kinder Morgan is also working to establish itself as an Eagle Ford condensate shipper. Kinder is building a condensate pipeline that can move 300,000 bpd from the shale basin to the Houston area, which is already being used to capacity.From Houston, the condensate from Kinder’s line moves through the company’s Explorer pipeline to Hammond, Illinois.

That’s progress, but Canada is still hundreds of kilometers away. To connect its system to Canada, Kinder has two plans:

1. Extend Explorer to connect with Enbridge’s Southern Lights—one ends and another starts in Illinois.  That link  should be in service by early 2014.

2. The other is to connect Explorer to the Cochin pipeline. Cochin moves propane 1,900 miles west to east—from Alberta to Ontario—through the US, crossing the border in North Dakota and skirting south of the Great Lakes before re-entering Canada in Windsor.

Propane volumes have been declining, so Kinder is proposing to reverse and expand part of Cochin—from east to west—to move 95,000 bpd of condensate from Illinois to Alberta.

Industry support for the project is clear: when Kinder held an open season on its Cochin proposal, the company received binding commitments for 105% of the proposed capacity. US regulators approved the plan in October; Kinder is now awaiting word from Canadian regulators. If all goes according to plan, the reversed Cochin will start moving condensate from the Midwest into Canada by mid-2014.

Plans from Kinder and Plains All American alone will increase Eagle Ford condensate capacity to Alberta by 170,000 bpd by the middle of 2014. Other pipeline projects are also in the works. Not willing to wait, some US producers moving their condensate to Canada by rail.

The upgrades are coming, and all signs indicate that every condensate pipe in the works will be filled to the brim almost from day one. Even without much dedicated infrastructure, condensate sales from the US to Canada have skyrocketed in recent years. Every estimate is different, but some analysts estimate that US condensate exports to Canada have grown 1,000% in the last two years alone.

CONCLUSION

Condensate capacity from the US to Canada should increase dramatically—but it is over a year away.  Oil and gas marketers in Alberta tell me oilsands production is rising fast enough to use a lot more condensate—but only time will tell if the market stays in balance, over-supplied, or under-supplied.

There’s a lot riding on this equation for Canadian natural gas producers—strong condensate pricing is the only thing between a lot of them and bankruptcy.

– Keith

by +Keith Schaefer

Turkey’s Dadas Shale: One of the World’s Top Unconventional Shale Oil Plays

0
In Part 1 of our story on Turkey, contributing editor Jen Alic reviewed the country’s intriguing onshore and offshore oil potential. Today in Part 2, we’ll look at where the Big Prize lies:  the Dadas Shale—a huge unconventional shale play—and which Canadian-listed junior producers may be best positioned in this emerging play.- Keith

———————————————

The Dadas Shale has the size and most potential to ignite both Turkey’s energy sector and the stocks of the North American listed juniors there. It’s a geological look-alike to the Woodford and Eagle Ford shales in the US.

This large shale is estimated to have more than 100 billion barrels of original oil in place (OOIP)—but nobody has produced large amounts of oil from it yet.

In southeast Turkey, Dallas/Istanbul-based TransAtlantic Petroleum Ltd. (TNP-TSX; TAT-NYSE) has come closest, recently announcing two 500 bopd horizontal wells in a conventional reservoir (think of the old-style oil pools vs. the new shale, tight oil) in the Mardin formation, above and below the Dadas shale.

Turkeymap-60 2

TransAtlantic and Calgary-based partner Valeura Energy Inc. (VLE-TSX) also drilled a successful 150 bopd horizontal well in the same formation to the west at Gaziantep. These horizontals are firsts for Turkey.  That got everyone’s attention—that oil had to be sourced from a local rock.

TransAtlantic and Valeura and their partners have also found oil in a new play in southeast Turkey in the Bedinan formation which is just below the Dadas Shale but oil is also sourced from the Dadas. This is relatively tight oil but a recent frac by TransAtlantic in the Bedinan has shown that production rates can be significantly improved.

“In the last six month we started having success in the southeast oil plays,” says Chad Potter, VP Finance of TransAtlantic. “We’re coming at it from multi-play idea on each license; where there is stacked pay, all likely sourced from Dadas shale.”

‘Stacked pay’ is industry talk for several underground oil formations all on top of each other like blankets on a bed. This allows producers to drill off several horizontal wells at different depths from one surface location—lowering costs and making production more profitable. It’s what everyone is trying to do with shale plays in North America.

Potter said in a recent interview with Natural Gas Europe that investors understand that Dadas could be a big international shale discovery.

“Horizontal drilling and frac technology is changing the game in chasing oil in southeast Turkey,” said Jim McFarland, President and CEO of Valeura. “The Dadas Shale is a world-class source rock that has fed giant fields across the Middle East and North Africa.”

TransAtlantic, along with Calgary-based Anatolia Energy and Valeura, definitely need to reward shareholders. All three have had a spotty exploration record over the last two years, and all of their share prices have lost 75% of their value from two years ago. (To be fair, most junior international exploration stocks have done the same.)

TransAtlantic’s next important well, the Bahar-2H, has already spud and is targeting the Bedinan formation, directly below the Dadas shale and the company plans to complete the well with a multi-stage frac.

Anatolia Energy (AEE-TSXv) CFO Pat McGrath says their company is doing a production test into the Dadas shale in September, with what will likely be a two-stage vertical frack. They’re hoping for as much as 50 bopd per frack stage as a goal to shoot for.

Other operators are also into Dadas. Shell stepped back on to the scene in September 2012 in partnership with Turkey’s state-owned TPAO. Exxon Mobil is said to be seeking an opportunity in the Dadas.

Potter, McGrath and McFarland are keen to point out that the majors’ return to Dadas means that they were right to focus their investment here—even though the payout will be a while in coming.

“The greatest potential in Turkey is in the unconventional plays. Turkey is essentially in the same stage as the North American Basins were in 2002. These plays have completely changed the North American oil and gas sector,” McGrath says. “This is the only opportunity to make a large enough impact to reverse the declining oil production in Turkey

One thing holding back even more exploration in Turkey is lack of access to Turkey’s historical geological and production data. While Turkey has been exceptionally generous with foreign oil and gas companies—offering some of the “most attractive fiscal terms in the world,” says McGrath—it maintains a tight lease on data that could help unleash the shale bounty.

With all the other pieces in place, the main question for the industry right now, says McGrath, is “how and when we will be able to access the old producing fields, now held by the National Oil Company. These fields hold great potential for re-activation using unconventional technology. In the meantime, the national oil company just maintains marginal production through conventional wellbores.”

And this is what Transatlantic, Anatolia and Valeura are banking on. For all, there is a strong focus on the Dadas Shale and the Bedinan and Mardin formations. Both are in the southeast.

For Potter it’s essential to look at this from the “eye of the North American unconventional attitude.”

Do the markets agree? Well, not just yet. The markets are saying “prove that any of this works,” according to Potter.
But lately, each time they  unlock a bit of value they have unlocked a bit of the stock price, as the stock chart has started to turn positive.

Turkey’s BIG FIND is yet to happen. But the Dadas Shale gives the country its best chance at igniting a staking and production boom that could rival what’s happened in the United States in the last five years.

JUNIORS IN TURKEY–QUICK FACTS 

TRANSATLANTIC PETROLEUM LTD (TAT:AMEX) (TNP:TSX)

Shares Issued                                    368.7 million

Fully Diluted                                    370.2 million
Share Price                                       $0.89 (price at close Jan 29 13)
Market Cap                                       $328.143 million
Net CASH                                        $26.2 million
Enterprise Value                               $301.943 million
Production                                       4,630 bopd (as of Nov 12, 2012)
Price per flowing barrel                    $65,214Positives
  • Holds massive acreage in Turkey, Bulgaria and Romania (5.4 million acres—4.3 million in Turkey which includes 57 onshore exploration licenses and 9 onshore production leases)
  • The sale of its Viking International oilfield services this year raised $157.5 million, which went to pay off debt and improve financials.
  • Production should pick up in the first quarter of 2013 in the Molla license, with another exploration well (Goksu-3H) naturally flowing as of late October 2012 and additional horizontal drilling planned.
  • Fracture stimulation of the Bahar-1 exploration well should be under way before the end of this year.
  • TransAtlantic owns 100% interest in Goksu-3H and Bahar-1
  • Four operated rigs running–two in the Thrace Basin and two in southeastern Turkey.
  • Plans for an initial 88-well development program for the Tekirdag field area (over the next 3 years)
Negatives

  • Lot of shares out already
  • Total net sales have declined slightly from Q2 to Q3

QUICK FACTS on VALEURA ENERGY INC (TSX: VLE)

Shares Issued                     57.9 million
Fully Diluted                     77.35 million
Share Price                        $1.00 (price at close Jan 29 2013)
Market Cap                       $57.9 million
Net CASH                         $29 million (at September 30, 2012 proforma after October capital raise)
Enterprise Value                $28.9 million
Production                         1,140 BOE/d (as of Sept 30, 2012)
Price per flowing barrel    $26,219

Positives

  • Money raised at higher prices–$1.30/share
  • Annualized cash flow from Turkish production of $11-12 million at current production rates
  • Working capital surplus of more than $29 million
  • No debt
  • Non-operated partner in Turkey with TransAtlantic
  • Interests in 23 leases and licenses in Turkey for a gross acreage of 2.2 MM
  • Analysts expect Valeura to benefit in 2013 from multi-stage fracture treatments in vertical wells in these tight gas and conventional gas targets

Negatives

  • Q3 oil and gas sales down 15% from Q2 (largely due to slowing of drilling/fracking in Thrace Basin for evaluation of Q2 results)
QUICK FACTS on ANATOLIA ENERGY CORP. (TSX.V:AEE) (PINK-BEEHF)Shares Issued:                     131.06 million
Fully Diluted:                      243.99 million
Share Price:                         $0.05 (as of close Jan. 29, 2013)
Market Cap:                         $12.2 million
Net CASH:                          $4.5 million
Enterprise Value:                 $7.7 millionPositives
  • Has 11.6 billion barrels of original oil in place in Turkey; 47 million barrels of net unrisked prospective resources in Turkey
  • Lots of acreage (1,16 million gross acres)
  • Good acreage diversification in Turkey: 11 licenses in four play types, including conventional and unconventional
  • Positive working capital balance; cash on hand
  • Renewed interest in the Dadas Shale play by the majors may boost Anatolia’s prospects in this play
  • 50% interest in the Dadas Shale play
  • No debt
Negatives
  • Anatolia is banking a lot on the Dadas unconventional shale play, which is still in a very early stage of development
  • No production yet

Author–Jen Alic

Editor’s Note:  New OGIB stock pick Valero Energy Corporation (VLO-NYSE) is enjoying a very solid run since we added it to the portfolio — and since that time, management announced news that blew away analysts’ expectations. I bought Valero after I determined it as the one refiner with more leverage to the Gulf Coast light oil price (it’s declining) than anyone else. I admit I don’t normally buy large caps, but in this case I’m riding a bull market that has legs (refinery stocks were just on fire yesterday).  I’m in a better situation, though, with another play with legs — the company is making a ton of money, plain and simple — and shareholders are being rewarded for it.  It’s a stock I expect will continue to perform… so if you’d like to learn more about it, go here to keep reading.

A Different Way To Invest in Natural Gas Stocks

0

When investors ask me about investing in natural gas stocks, I give them the single most important question to ask producers: How much condensate do they produce? Ask about condensate.

Condensate is essentially a very light oil which is condensed from rich natural gas and solution gas from oil. And the price of it is skyrocketing, because it’s used to dilute both regular heavy and synthetic oil from the oilsands. It’s the saving grace for a lot of Canadian producers.

See this chart below. It shows Canadian condensate prices against WTI—see how the value of condensate is rising rapidly? In August 2012 it was only $3/barrel more than WTI. Now it’s $14 more—giving producers with lots of condensate even better economics than most oil producers!


And prices will only get better for condensate producers, one Alberta based oil and gas marketer told me, asking to remain anonymous.

“Supply and demand (for condensate) are just touching each other. Any more heavy oil coming onto market will have a big impact. We need to find other sources (of condensate).”

Or, he says, condensate prices could go even higher. He estimated that if the oilsands increases production by some 400,000 barrels per day (bopd) a year for the next several years, an extra 100,000 bopd of condensate is needed—each and every year.

I’ll explain in my next story, condensate part III, how US imports of condensate are happening, but not fast enough.

In Canada, most condensate is found in shale and tight gas formations. In the US, it’s mostly in gas associated with shale oil, especially the fast-rising Eagle Ford play.

In the United States, all this condensate is almost a problem. US refiners spent billions of dollars over the last decade to process more heavy oil. As a result they can’t really handle this light stuff.

But for Canadian gas producers, condensate is the only product that gives them substantial positive cash flow (a very few producers do make some cash flow on dry gas.) That’s why it’s so important to know how much condensate the gas producers are flowing.

Canada’s Thirst for Condensate

In the oil sands, condensate is used as a diluent to ‘thin down’ bitumen – a thick, sludgy substance – so it will flow through pipelines. Since bitumen production is climbing steadily, condensate demand is on the rise. Supply is struggling to keep up.

Canada now uses some 275,000 barrels of condensate per day as diluent. Canadian producers churn out 165,000 barrels per day (bpd), meaning oil sands operators already rely on imports to fill a 110,000-bpd gap.


That’s good, but it will probably get even better. Capital spending in the oil sands is expected to exceed $20 billion per year for the next five years. The more bitumen that is pulled from the sands, the more diluent Alberta will need to move all that heavy oil to market.

This year Canadian demand for condensate is expected to average 300,000 bpd. By 2020 demand is expected to reach 670,000 bpd, according to the Canadian Energy Research Institute, which also provided the following chart.


As you can see from the bottom red part of the chart, Canadian condensate production is not expected to increase much in the coming years. That in itself is bullish. But there are two other infrastructure bottleneck that should help keep condensate prices high for at least two more years.

One issue is that Canadian NGL processing facilities are basically full. That is impacting (reducing) condensate production in the short term—creating further supply stress.

So Canadian producers are shipping in tanks directly to their wellsites, and trucking it to local markets; they’re not sending via pipe to processing plants (fractionation plants). The other reality is—and I’ve said this many times—the energy game is changing so fast in North America—fast rising production in both oil and gas, new channels to market (rail)—that nobody knows what the landscape is going to look like 2-4 years from now.

That uncertainty is causing Big Energy Money to be cautious about increasing refining capacity for oil and gas in Canada—which again, is good for commodity prices.

The second bottleneck is pipeline capacity INTO Canada.

The US is actually swimming in condensate–it accounts for as much as half of the output from US shale oil and gas basins. Refiners are buying some of it simply because it is cheap, but a condensate glut is also developing in the Lower 48.

Now however, there is only Enbridge’s Southern Lights pipeline bringing condensate into Canada, and it’s not near enough. (There is some incoming condensate by rail, but now that is still small.) In Part II of this series, I’ll explain in detail this bottleneck, and what’s happening to get rid of it.

Once that glut starts moving into Canada apace, the price premium that Canadian condensate producers are currently enjoying will shrink. Condensate will still carry a good price, but the edge will be smaller.

But I expect that to be at least two years away, and if oilsands production keeps increasing, it may be even longer.
In conclusion—the growing demand for condensate in the oil sands is driving up its price. This isn’t just saving the lucky Canadian gas producers who have high condensate levels, it’s giving them better economics than most oil producers.

Pipeline bottlenecks in the US and processing plant issues in Canada should conspire to keep condensate prices high—making it the best (and least volatile) upstream commodity stories in North America.

Next, I’ll explain in detail what’s happening to condensate in the US, and the efforts to get as much up to Canada as fast as possible. In general, ‘fast’ means 2014 at the earliest, giving investors lots of time to benefit from strong domestic condensate prices.

by +Keith Schaefer

Read Part 1 of my condensate series here. 

P.S. I think right now is one of the BEST times for investors to discover my #1 condensate play in Canada. Learn all about my Top Pick risk-free right HERE.

A Bullish Case for Investing in Condensate Producers

0

Condensate prices in Canada are soaring—now sitting some $14/barrel ABOVE WTI—making it the most valuable Canadian energy product.

It’s creating huge profits for the lucky few natural gas producers who have large condensate volumes in their production stream.Condensate is both a heavy Natural Gas Liquid (NGL), and a super light oil, making it very versatile.

In Canada it’s used to dilute heavy oil from the oilsands, and fast increasing production there is driving condensate demand—and prices.Canadian production of condensate is flat, which is bullish in the face of oilsands growth.

But there is a cloud on the horizon—fast-rising US condensate production, particularly out of the Eagle Ford in southeast Texas.

I’m in Texas this coming week—the Eagle Ford in particular—on a property visit, and to learn more about the how and when the glut of American condensate could flow up to Canada.

In my next story, I outline the very bullish case for Canadian condensate prices and producers—both from the supply and demand side. I’ve been talking to oil and gas marketers in Alberta to get an “on-the-street” view of what’s happening, and what the industry insiders think could happen.

And it’s all good news for condensate producers. That’s why I’ve made one junior condensate player one of my largest positions.

Part III of my series will focus on US efforts to get more condensate to Canada to take advantage of that great pricing. A lot of that article will include what I learn this week in Texas.

Today, to set up this profit picture, I explain the basics of condensate—a very complex molecule—in a simple way:

The What and How Much of Condensate

Condensate is oil, but a very light kind of oil. Here, ‘light’ describes the weight of an average molecule –condensate is made up of short hydrocarbon molecules that weight much less than the long hydrocarbon molecules in regular crude oil.

The API gravity system describes hydrocarbon weights. It’s a system that uses an inverse scale: the higher the number, the smaller the molecules. Technically, condensates have an API gravity of 50° or higher. For contrast, WTI crude has an API gravity of about 39°, Brent sits around 35°, and crudes considered ‘heavy’ are those that come in below 22°.

Condensate earned its name because it is a vapour in its underground reservoir that condenses as its rises the surface, where the temperature is lower. And to be precise, condensate refers to a mixture of hydrocarbons, running the gamut from highly volatile natural gas liquids to naphtha range materials resembling gasoline.

(The other NGLs commonly produced with condensate and regular dry gas (methane) include ethane, propane and butane, and are much LESS valuable than condensate.)

So just how much condensate is North America producing?

Oil and gas wells in North America have always produced some condensate, but of late condensate production has simply ballooned. That’s because it’s produced alongside shale oil AND shale gas—and we all know how much that has increased in the last five years.

From the Eagle Ford shale in Texas to the Bakken shale in North Dakota and up to the Montney shale in northern BC, oil and gas shales are producing major volumes of condensate.

It is difficult to know exactly how much because few producers report condensate production volumes. Instead condensate gets lumped in with crude oil or added to natural gas production numbers by reporting both in terms of barrels of oil equivalent (which is misleading in all kinds of ways).

However, while I can’t pinpoint precise condensate production numbers, I can get a good idea of condensate volumes by examining individual plays or provinces.

BC is a good place to start. The Montney shale basin in the province’s north is earning a reputation of producing lots of condensate and natural gas liquids alongside its natural gas, bonus co-products for companies in Canada where condensate demand is high.

The drilling rush in the Montney started in about 2009, when natural gas prices fell and producers realized that co-produced natural gas liquids (NGLs) and condensate in the Montney turned uneconomic gas wells into profitable ones. As a result, between 2007 and 2011 annual condensate production in BC increased 28%. BC now produces more condensate than crude oil.

But condensate production growth in BC is a mere shadow of what is happening south of the border.

The best example comes from the Eagle Ford shale basin, which stretches across much of south and east Texas. The shale’s tight sedimentary rocks contain a range of hydrocarbons:

1.    wells on the southeastern flank generally produce dry gas,

2.    wells in the middle produce gas, NGLs, and condensate, and

3.    wells to the northwest generate oil and condensate.

Eagle Ford producers drilled their wells looking for oil or gas. Condensate was an unexpected bonus – but it now makes up a huge amount of the hydrocarbons produced from the formation.

Forecasts predict that total Eagle Ford oil output will reach 500,000 to 800,000 barrels per day by 2020. Up to 40% of those barrels will be condensate.

Compare that to 2011, when condensate production from the formation averaged 130,000 barrels per day. It means condensate production from Eagle Ford will likely grow by 150% in less than a decade. And Eagle Ford is just one of a slew of shale basins being drilled and fracked in the United States to produce oil, natural gas, NGLs, and condensate.

It sounds great, right? Not only are shale basins producing the natural gas and crude oil expected, they are also churning out piles of condensate, a hydrocarbon mixture so light you could often pour it straight into your tractor. Condensate must be making US shale producers happy, right?

Wrong.

Stayed tuned – this tale will continue for some time. Again, while I’m in down in Texas I’ll be talking to shale producers and quizzing condensate marketers, and find out what is being done to monetize this unexpected bounty of light oil – and what the impact will be for Canadian shale producers, who are now making a killing on condensate.

In fact my research has uncovered where North America’s richest, most valuable condensate is. And I know the junior producer with the most leverage in the play… a potentially huge win in the making. Continue reading here.

by +Keith Schaefer

Read Part 2 of the condensate series here.
Part 3:  From Eagle Ford to Canada: An Unexpected Surge in U.S. Condensate Production


Privacy Overview

This website uses cookies so that we can provide you with the best user experience possible. Cookie information is stored in your browser and performs functions such as recognising you when you return to our website and helping our team to understand which sections of the website you find most interesting and useful.