The 3 Factors That Will Decide the Oil Price in 2019

0

In this short video, I tell you where I think the oil price is going in 2019, and three factors that could make oil have a big swing in price – either up or down. Click on my picture below to hear my thoughts (and sign up for my YouTube channel!), or scroll down the page to read a rough transcript. Thanx for watching and have a Happy New Year!

Capture 

click here to watch the video

Hi, I’m Keith Schaefer from the Oil and Gas Investments Bulletin. My job is to give my subscribers the best money-making ideas in energy.

So what do energy investors have to look forward to in 2019? Where can we make money?

The Big Lie of 2018 was that few oil stocks followed the oil price upwards in the first nine of months of 2018 – and of course ALL oil stocks collapsed with oil in the last quarter of the year.

I see that happening again in 2019 – in the sense that I don’t see oil producers as the best place to make money in energy this year. I’m neutral on oil in 2019; I see volatility calming down and WTI prices a lot more stable in the low-to-mid-$50s. That’s not good for most oil stocks. But how could I be wrong?

I see the Three Big Factors for oil moving up or down in 2019 being

  1. Saudi Arabia and
  2. Venezuela.
  3. Will the world have a small recession this year, lowering demand growth

The US is NOT a big factor, because investors know what is going to happen there – production will likely increase another million barrels a day. To me, that’s a given. US management teams are just built to grow.

They can’t stop themselves and will continue to grow production on thinner and thinner margins, i.e. lower prices.

Even with a greater commitment to live within cash flow, I see US production jumping up at least one million barrels a day – which should take care of most of the increased demand in 2019. I think WTI would have to stay close to $45/b for at least a couple months for US production growth to slow. The rig count would have to spend most of the year at 600 for production to flatline. It’s now over 1000.

So that means it’s up to the Saudis to decide if they are willing to give up that million barrels a day to even sustain Brent prices here at $55-$60, then investors can make money on some of the larger producers, whose share prices have been hit hard.

I hear a lot of oil commentators talk about a price that the Saudis NEED to preserve social stability. I’m not sure I believe that, but certainly that number is $70-$80/barrel.

The other big wild card is Venezuela – if their production keeps collapsing, then oil could do better than I expect.

And folks, I don’t care how long you’ve been studying oil or how many letters are behind your name – PhD or whatever – nobody knows how those two countries will play out in 2019.

The third big factor in 2019 will be oil demand. For the last few years, oil demand has increased about 1.4-1.5 million barrels per day, and the world is now using 100 million barrels a day of oil. That’s a huge number!

But a lot of big consuming countries are slowing down. China is certainly slowing down. Industrial production growth is down to the lowest level since the 2008 financial crash at 6%, and retail sales growth is down to 8%.

Germany has already had one quarter of negative GDP. And as strong as the US economy is, it’s actually overheating right now, and that usually means higher interest rates and a slowdown.

Now, I am not talking about a big recession… I’m just talking about a normal business cycle slowdown. Industrial commodities like oil, copper, zinc and steel all had sharp downturns in Q4 18, and of course, the stock market also tanked.

Again, nobody knows if there will be a recession or not, or how that might impact oil demand.

There’s a couple other things to think about oil.  Despite the fact we have lots of oil… inventories are still at normal to high levels – there is really very little spare capacity in the world – and I really mean ZERO. Everybody is producing as much as they can at any given time. I really thought the world would give oil a bit of a premium there, but that is not happening.

It’s true that if Africa – particularly Nigeria and Libya – could find peace, then oil supply would certainly overwhelm demand. But I see that as a remote chance, so it’s not part of my Big 3 Factors.

To recap:

  1. I think WTI will average in the low-to-mid $50s per barrel.
  2. I think Brent will average just over $60/b
  3. The 3 Big Factors for oil in 2019 – that are unknowable – are
    1. What will the Saudis do
    2. Will Venezuela production collapse
    3. Will there be a mild global recession

I think the uncertainty here will keep investors out of small cap oil stocks. The larger producers are trading so cheap now – I follow a couple that are 2-4 x cash flow, which to me is unbelievable – that small stories make little sense now.

There are only two oil stocks right now that to me are so compelling I want to actually increase my position. I’ll tell you about them – and a couple other money-making ideas – in my next video.

Have a Happy New year and thank you for watching.

Click here for monthly access $ 59 a month (no refunds)

Click here for quarterly access $ 149 per quarter (30 days no-questions refund)

Why Do O&G Producers Do Share Buybacks?

0

On December 13, 2018 Pioneer Resources (PXD:NYSE) announced a whopper of a share buyback program – $2 billion, up from the existing program that covered re-purchases of up to only $100 million.

Great news for shareholders right?

I’m not so sure.

I’m feeling feisty this Christmas. In fact I’m going to play a little bit of Devil’s Advocate and make a bit of a bold blanket statement….

I think oil producers repurchasing stock is a bad idea!

1

Before You Call Me Names – Hear Me Out 

Don’t shoot before you hear the reasoning behind my message.

I understand perfectly well the value of share repurchases and how effective they can be – when done buying back shares that are trading for less than intrinsic value.

In fact I love the idea of a smart Board of Directors taking advantage of an opportunity presented by a depressed stock market use repurchases to “goose” earnings per share.

I just happen to think this industry is different. This industry is tough.

My suggestion is that for oil producers (or any commodity producer really) there is a smarter place to put excess cash than into share repurchases. That place is the balance sheet.

I suggest that these companies should keep reducing debt until they don’t have any. Seriously – none.

And after that I wouldn’t minds seeing them build a bit of a cash hoard.

These are the things I think (with a dose of Devil’s Advocate)… now let me tell you why.

Reason #1 – In The Commodity Business Low Cost Wins Always

This is a painfully cyclical business. It never fails to amaze me is how extreme the high and low points are… and how frequent.

But this (gut-wrenching) cyclicality is what creates such great opportunities.

For the producers however it must be a nightmare.

From 2010 through mid-2014 the price of WTI crude ranged from $73 to $107 per barrel. If you had told the CEO of any oil producer at that time that in 2016 WTI would hit $26 per barrel they all would have laughed at you.

But that is exactly what happened and it happened without a recession!

That cyclicality isn’t going away and nobody knows where commodity prices are going. Recent history shows that prices can go to absurdly low levels. Companies can hedge their commodity price risk for a period of time, but they can’t hedge it forever. Plus that hedging is expensive.

The best way for companies to make sure that they always stay profitable is to have the lowest cost operations possible… and that includes interest expense.

Having as little debt as possible is a certain way to have an “all-in” operation cost per barrel advantage over the competition. Remember this is a commodity business… you can’t differentiate yourself on the quality of your product.

You have to gain your advantage by being a low cost producer.

When commodity prices dip to unfathomably low levels (which happens with surprising frequency) that cost advantage can mean the difference between life and death.

In better times less debt means that you still have a profitability advantage over your completion.

Reason #2 – Debt Means That Someone Else Is Ultimately In Control Of Your Destiny

I love people but I’ve taught all of my kids that they don’t ever want to put themselves in a position where they need to rely on the kindness of strangers for their basic necessities of life.

At the core of what I teach my kids is to respect the dangers of debt.

When oil crashed in 2014 and stayed down (nobody saw that coming)… there was a long line of oil producers that were forced to rely on the consortium of banks that were on the other end of their credit lines.

Many of the producers found that those strangers weren’t so kind. And who can blame them? The banks forced the producers to sell progressively better assets at progressively worse prices as oil prices stayed low.

With oil in the $30s/b there were only a few oil producers generating any positive cash flow from operations… they were incapable of making their debt and interest payments.

As long as you have debt, you aren’t necessarily in control. Especially when your cash flows are determined by the movements of a volatile commodity.

The more debt you have the more likely you are to eventually be begging for help.

Reason #3 – Low Debt Equals Premium Valuation

The idea of share repurchases is to return capital to shareholders… to reward them.

Here is a thought though. How about doing everything possible to attract even more investors to want to own shares and eventually reward everyone with a higher share price?

There is no more sure fire way to make sure of a premium stock market valuation than having a best in class balance sheet.

Low-debt companies routinely trade at valuation multiples that are 2 or 3 turns above where companies with more leveraged balance sheets trade. It almost doesn’t matter what the more leveraged names do operationally – the stock market just doesn’t reward companies with lots of debt.

You know the overleveraged zombie stocks of which I speak – whose shareholders suffer from a permanently discounted share price.

Reason #4 – That Premium Valuation Can Be A Weapon

I’ve always loved companies with expensive looking stocks… ALWAYS.

That might seem counter-intuitive because I am very aware of value when I invest. What I have always appreciated is that having a stock with a premium valuation can be a powerful weapon in the public markets.

The entire idea behind share repurchases is to do something accretive for shareholders… by buying shares at a discount and increasing value per share for remaining shareholders (giving them a better piece of the pie).

An expensive stock can be used to do exactly the same thing. A company trading at a premium 9 times cash flow can issue shares at that valuation to purchase another company at 6 times cash flow… an immediately accretive transaction.

Reason #5 – Being Cash Rich And Debt Free Lets You Love The Crashes

Do you know who had a heck of a good time during the Financial Crisis in 2008?

That smart old Warren Buffett who was sitting with a bucket load of cash ready to buy when almost everyone else was desperate to sell.

Not surprisingly by being the only buyer in this market allowed Buffett to make a bundle. Buffett made a bunch of investments at the darkest hour of 2008 as Lehman Brothers was collapsing. All of those investments worked out incredibly well… some spectacularly so.

Take for example the $5 billion in preferred shares of Bank of America that Buffett bought. Those preferreds paid a 6 percent annual dividend and came with warrant to purchase 700 million Bank of America (BAC:NYSE) shares at $7.14.

Buffett exercised those warrants in 2017 and now holds Bank of America shares worth $26 billion… with dividends included his profit is over $20 billion on a $5 billion investment.

Buffett made penny-stock-type-returns while investing in one of the biggest banks in the world.

At the bottom of every oil crash there are countless leveraged companies ready to be bought for pennies on the dollar… the alternative is bankruptcy.

All that is required is a Fort Knox balance sheet and then using it during low prices…like NOW.  The only problem is, most management teams don’t have PATIENCE.

Let Me Be Clear On What I’m Not Saying

As I noted at the start – I am playing a bit of Devil’s Advocate here.

Like with almost everything in life the best answer to this discussion likely lies somewhere in the middle… imagine if our politicians thought that way!

For me to say that oil producers should never repurchase shares would be going too far… there are obviously times that share repurchases make sense.

Take Parex Resources (PXT:TSX, PARXF:PINK) for example. I spoke with Parex’s Chief Operating Officer Mike Kruchten about the concept that oil producers shouldn’t repurchase shares and he said:

I think the difference for Parex is that we are debt free AND accumulating too much cash. Too much cash isn’t an efficient capital structure. Buying back shares still gives us future flexibility.

It is hard to argue with that logic.

For Parex, share buybacks make perfect sense. I would point out however that with the company sitting on $140 million in net cash and set to generate $300 million in free cash flow… Parex already has the Fort Knox balance sheet with which I’ve been suggesting oil producers should operate.

Which brings up another issue that Gluskin Sheff’s Leon Knight also mentioned to me on this subject… that we don’t need all of the cash that companies are putting into share repurchases instead being used to drive industry production growth even faster….

As per Leon:

“This is the dilemma, if industry just piles all of the cash back into the ground, too much growth keeps prices depressed and returns are marginalized. 
 
So in this environment, industry as a whole can either ramp up with a lower corporate margin – either lower cash margin from lower oil prices, or lower profit margin because of cost inflation) – or pull back on (capex)spend, increase your margin and return cash to shareholders (or pay down debt, or both).

If there is no real free cash flow generated within the business, this can be considered another avenue to destroy shareholder value (betting on commodity prices to increase asset value).” 

A valid point to be sure, but again I wasn’t advocating plowing cash into the ground drilling wells instead of share repurchases… I was saying that priority number one should be creating a Rock of Gibraltar balance sheet.

Too few oil producers have that today.  Much improved from 2014 yes… but there is plenty of room to improve balance sheets in this industry.

In conclusion then…

While I wouldn’t say NEVER to share repurchases I also think that I’m making a very valid argument.

I would be willing to say that oil producers should only by utilizing the repurchase tool until they have built a balance sheet that positions them to enjoy, rather than fear the next great crash… which appears to already have arrived.

Keith Schaefer

All Hail The King of Free Cash Flow in the OilPatch!

0

If free cash flow is King – then you can hand Canadian Natural Resources (CNQ-NYSE/TSX) the crown.

Generating free cash flow in the oil and gas production business is very difficult. Canadian Natural makes it look incredibly easy.

Let me be clear on what I’m talking about when I say free cash flow.

This is the cash flow that a company generates in excess of its capital spending requirements.

Free cash flow is what’s left-over after a company has invested enough to maintain the existing production level of the company.

Free cash flow is the cash that a company has available to pay dividends, repurchase shares, accelerate growth, reduce debt or just fatten up the bank account.

Free cash flow has always been at the core of Warren Buffett’s investing approach. Buffett refers to free cash flow as “owner earnings” – where he compares the amount of cash that a business produces relative to the amount of cash it needs to maintain the business.

Buffett’s Owner Earnings = Cash flow produced less capital expenditures.

Canadian Natural Resources – Gushing Free Cash Flow

Every management team in oil & gas will tell you that they have the best assets. Let me tell you, I’ve heard them all do it.

All of the companies can put together very compelling and convincing corporate presentations to back those claims up.

That is why I love numbers.

Cold, hard, numbers… especially cash flow numbers. Because you can’t fake cash flow.

Taking a dive into Canadian Natural’s Q3 financial statements that were just released tells you everything you need to know about this company’s assets. They are very different than what I’m used to seeing in this capital intensive industry.

Through the first three quarters of 2018 Canadian Natural has generated $7.9 billion in funds flow from operations. To maintain (and actually grow) production Canadian Natural will spend $3.2 billion to do it.

1

That means that in the first 9 months of 2018 Canadian Natural generated $4.7 billion in free cash flow. The true “owner earnings” figure that Buffett would look at is actually be higher than that since he wouldn’t factor in capital spending on growth.

The free cash flow that Canadian Natural has generated in 2018 is cash flow that the company can allocate as it sees fit.

In 2018 that allocation has been:

Dividends – $1.2 billion

Share Repurchases – $900 million

Balance Sheet Improvement – $2.6 billion

A very telling statistic is that the dividend yield from this $1.2 billion in dividend payments is 3.8%… yet even with that big yield the company was able to allocate 3 times more cash towards share repurchases and the balance sheet.

Canadian Natural is gushing free cash flow.

And despite massively underspending the amount of cash flow that it generates… CNQ still grows production at an impressive rate.

2

Over the past five years the company is at the head of the pack when it comes to a compounded rate of production growth.

More Number Crunching – Compare Cash Flow To Valuation

A great way to look at Canadian Natural’s current market valuation is to think about how long it would take for the company to repurchase all of its outstanding shares (assuming the current share price).

At the end of Q3 2018 Canadian Natural has 1.2 billion shares outstanding.

With the company’s share price bouncing around $35 per share that means that the market capitalization for Canadian Natural is $42 billion.

Next year Canadian Natural has provided a range of cash flow from operations guidance that factors in worst case WCS differentials to better case WCS differentials.

That cash flow guidance range goes from $6.6 billion at the low end to $9.3 billion at the high end. But it gets better – note that through three quarters of 2018 Canadian Natural was on pace for $10.5 billion of cash flow from operations this year.

3

From those operating cash flow figures I’ll deduct the $3.1 billion of maintenance capital spending that needs to be done to sustain production.

That gives me these three free cash flow (operating cash flow – maintenance capex) figures:

2019 Worst case – $6.6 billion less $3.1 billion = $3.5 billion

2019 Best case – $9.3 billion less $3.1 billion = $6.2 billion

Q3 2018 run-rate case – $10.5 billion less $3.1 billion = $7.4 billion

If Canadian Natural were to choose to hold production steady and plow all of that free cash flow into share repurchases….

At the current share price of $35 it would take the company this long to repurchase 100% of its outstanding shares:

With $3.5 billion of free cash flow —- $42 billion / $3.5 billion = 12 years

With $6.2 billion of free cash flow —- $42 billion / $6.2 billion = 6.7 years

With $7.4 billion of free cash flow —- $42 billion / $7.4 billion = 5.7 years

Those are some pretty incredible numbers… even the worst case scenario.

I find the numbers especially incredible when you consider that at the point when all of the shares had been repurchased that last remaining shareholder would be sitting on a company that had maintained production at current levels and still had another 8 billion barrels of oil to produce in the years ahead.

4

What is the secret to Canadian Natural’s massive free cash flow story?

It is all about the company’s incredibly low production decline rate. With zero capital being invested, CNQ’s production would only decline by 10 percent per year.

That means that the company has to spend very little to maintain existing production and just a little more to grow it.

That leaves all of that excess cash flow to be used in whatever manner Canadian Natural’s leadership believes is in the best interests of the shareholders that they serve.

5

6

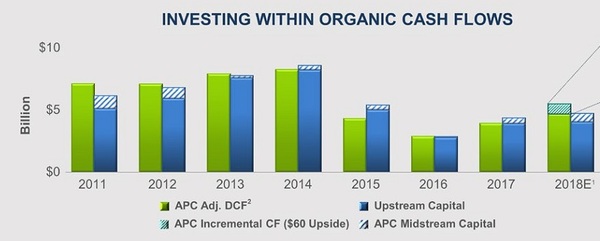
Compare that to a competitor like Anadarko Petroleum (NYSE:APC) which has generated no free cash flow to speak of over the past eight years combined (see the APC slide below). The difference between the green bar and the blue bar in each year = free cash flow. Investors want to see the green bar be MUCH higher than the blue one.

APC Anadarko Free Cash Flow for CNQ article

Canadian Natural generates billions of dollars of free cash flow each and every year. This shows the huge advantage that Canadian Natural’s low decline production creates.

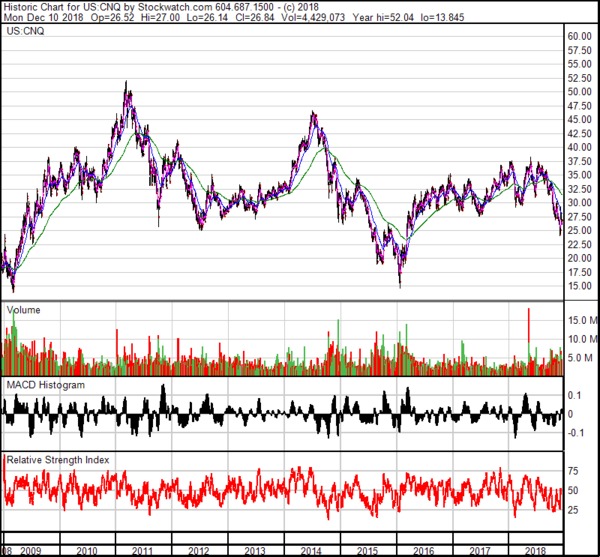
The stock has only been lower than the current price twice – once in 2015 after the Saudis pulled the rug out from under the world oil market, and once in late 2008-early 2009 when investors feared for their financial lives.

CNQ Cdn Natural 10 yr chart Dec 10 18

The King of Free Cash Flow is a lot stronger than its stock price would suggest. And with heavy oil differentials now reverting to a normal $15/barrel discount (saved by the gov’t!?), their strong cash flows look to continue.

Keith Schaefer

Are You Positioned For A Big Bounce In Oil Stocks?

0

There is a hard bounce coming for the share prices of oil producers. Of that I’m sure.

The smaller the company, the bigger the bounce.

On October 3rd WTI oil prices hit a four year high of $76 per barrel. Then 15 months of a slow upward move in oil prices disappeared.

1

It took 15 months for the price of oil to go from $50 to $76 per barrel. Then it took just a couple of weeks to give all of those gains back.

What a volatile market.

The stock market took this big move and amplified it. The share prices of oil producers have moved even more… especially the little fish.

What drove oil prices down this much this fast? Increasing production out of Saudi Arabia and the US for sure, but big short term moves like this often have more to do with derivatives, and non-physical trading in oil futures.

Oft-times this kind of short term volatility has little to do with anything rational at all.

Welcome To Our Reality – Short Term Prices Are Set By Algorithms

The amount of trading being done in our public markets by machines with no human oversight has grown to staggering levels.

Company fundamentals, supply and demand, and balance sheets matter less than ever before.

Today it is all about momentum and algorithms. How much money a company makes is far less important than whether its share price just had its 50-day moving average go above or below its 200-day moving average.

Computations and calculations. Not free cash flow or dividends.

These are machines trading meaningless pieces of paper. There is no question this is a far cry from the purpose that our capital markets were created for… which was to give deserving companies the ability to raise capital at fair prices.

Earlier this year the Financial Times reported that money managed by purely algorithmic hedge funds crossed the $1 trillion mark. That is a $500 billion increase since just 2010. Both enormous amounts of money.

And that doesn’t include the trillions and trillions of dollars managed by mindless index funds and etfs. JP Morgan has estimated that today just 10 percent of the purchases and sales of stocks are completed based on actual stock picking.

Did you read that? 90 percent of buy and sell decisions are made with zero thought given to how a company is performing!

It is ridiculous.

These algorithmic/robot trading platforms trade at lightning speed and at huge scale.

Increasingly stock prices are not being determined by what is happening with the underlying business. And with momentum being the key driver of algorithmic trading stock prices can get pushed further from what a company is truly worth than ever before.

That is the stock market. The oil market is no different except even more volatile since there are far fewer players in the game.

Small wonder then that when oil started down after hitting a four year high on October 3rd that the downward momentum got out of control.

What we all need to understand is that in the short term fundamentals mean less than ever before.

Which actually isn’t a bad thing for investors who can keep their stomach in check through the increased levels of volatility.

Here’s another interesting fact – professional traders now trade a huge – no, CRAZY – volume of energy futures each day. It’s over 33 times – that’s 3,300% – the world demand for oil. So think that world uses 100 million barrels of oil per day. The average dail trading volume of key energy futures is $330 billion. Talk about the tail wagging the dog

That’s up from 4.5x world demand in 2002, and 13.8x demand in 2007.

But eventually the fundamentals do matter. The market will eventually get the price right. Yes a company can trade at 30 percent of what it is truly worth, but that can be rectified very quickly by an acquirer moving in to take advantage.

The opportunities that the algorithmic dominated market can create are actually better than ever. The only caveat is that the trip getting to that true value just involves a much bumpier ride, one that can take you a long way off course.

Oil and Shares Of Oil Companies Could Bounce Big

I’m not saying that oil prices shouldn’t have dropped.

That isn’t what I’m saying at all.

In fact the main driving reason that oil prices should have backed off is that the Saudis have increased production by almost 1 million barrels per day from six months earlier.

2

It really is as simple as that.

Despite all of the noise you hear in and around the oil market the price of oil still does go through the actions of Saudi Arabia.

Why the market chose to ignore the Saudi production increase as a non-event for months is also not hard to understand. The momentum for 15 months was to the upside… the algorithmic programs just keep pushing the oil price higher.

But guess what?

The momentum down has been violent but it is ending. The big bounce in the other direction is coming.

Saudi Arabia does not want $50 oil. The Kingdom needs higher than that.

It is no surprise that the reports coming out of Saudi Arabia are now detailing that Saudis WILL cut production to turn oil prices around. The rumored production cut would be significant – a million barrels per day.

The oil price still goes through Saudi Arabia.

We are already seeing the momentum in oil prices and shares of oil producers start to change. All that we need is one really positive piece of news like a surprise weekly inventory announcement or a public Saudi comment on production cuts. As soon as that happens the robot/algorithmic trading platforms will send the oil price and share prices of oil prices shooting higher.

The risk in this sector is now about not being positioned for the big bounce that is coming… especially heading into the G-20 meetings this weekend. The New York Times is reporting that there is a very real chance that President Trump will push for a compromise with China.

An announcement on that front over the weekend would add 1,000 points to the stock market and who knows how many dollars to the price of oil when trading opens on Monday.

I think there’s a good chance that the share prices of junior oil producers – that the algorithmic robots have been selling mercilessly for weeks – get a big reprieve.

These days it is all about momentum. The extreme volatility works in both directions. The next move will be headed higher.
Keith Schaefer
Publisher, Oil and Gas Investments Bulletin

The Big Themes in Energy in 2018

0

December 31 can’t come fast enough!!!  What a year it has been for energy investors – almost nothing worked in the upstream (producers & energy services) sector, and the junior sector was particularly hard hit.

In today’s short video, I explain to you what The Big Energy Themes of 2018 were.  Next week I will share what I expect to happen in 2019, and how to position yourself in energy stocks to make money next year.

Click Here!

Capture 


Keith Schaefer
Publisher, Oil and Gas Investments Bulletin

The Biggest Bull Market in Energy is VOLATILITY

0

As a full time energy investor, I can tell you The Big Oil Stories of 2018 have been:

  1. Volatility in oil prices
  2. Oil stocks in general never really followed oil up in the first nine months of 2018. There were maybe a dozen stocks in the US that, if you owned them exactly for the correct 3 month long window – you made money (even fewer in Canada).  Otherwise you’re flat to down, and a bit puzzled as to why.

When it comes to volatility, let me show you how quickly the dominant meme in energy can change.

On Otober 22, US brokerage firm Raymond James (RayJay) held a big conference call to say both those stories will go away, and quickly, with oil prices and stocks about to take a huge upward move.

October 22 is a lifetime ago in oil news.

They made huge upward revisions to their oil price forecast through 2020.  On top of that, RayJay believes that shares of oil companies are cheap relative to $70 WTI having badly trailed the oil price recovery that started last summer.

They think oil prices are going up and the oil sector is going up more!

The New Raymond James Oil Price Targets

First let me tell you the specific new oil price targets that Raymond James has laid out for both WTI and Brent crude.

These are BIG upward revisions.

I’ll focus in on Q1 2020 because that’s where the firm sees oil prices peaking – though they do see prices staying strong well beyond that as well.

For WTI crude Raymond James has increased their Q1 2020 target price by a whopping $20 per barrel – from $75/b to $95/b.

You usually see big revisions like this after the price has moved.  Today we are under $70 and the recent momentum is negative… so this is a bold call.

For Brent crude the increase is even bigger.  The firm sees Brent at $105 per barrel in Q1 2020 which is up from the previous target of $80 per barrel.

These are obviously big revisions – almost 30% increase for both types of crude.

If this really does happen, revenue jumps 30% but cash flow almost doubles for a lot of producers.  This has obvious – and positive! – implications for oil stocks. So that is their view on oil.

More important to us is why it is the Raymond James view?

Does it make any sense?

Here Are The Reasons Why….

Before I get into this I want to make sure that you don’t get too focused on just the Q1 2020 date.  RayJay made sure to note that they don’t believe that high oil prices will just be a temporary thing.

Their bottom line opinion is that we should get ready for a steady dose of triple digit oil prices.

What changed?  Why did Raymond James bump their oil price targets by almost 30%?

The answer is increasing clarity on Three Big Issues – one of which they think the Market is ignoring to a great degree.

Let’s take a look at them.

Clarity On Issue #1 – Venezuela

The fact that Venezuelan oil production is a hot mess isn’t news.  Just how bad that mess has truly become is what is surprising.

At the beginning of 2018 RayJay was modelling for Venezuela 2019 production to be 1.65 million barrels per day.  At the time that was a prediction of a very steep decline of 300,000 barrels from 2017.

The reality has been much worse.

The most recent data here shows that production is already massively under the original 2019 target.  The production shortfall is much larger than expected and has happened much faster.

Q3 2018 Venezuelan oil production was just 1.25 million barrels per day in Q3 2018 – and it is still falling fast.

1

Half of the 2.5 million barrels per day of production (bopd) that the world had gotten used to having from Venezuela in 2015 and before is gone – and conditions in the country are getting worse not better.

With Nicholas Maduro’s election victory (if that’s what we are meant to call it) in May there is no realistic hope of reversing the fortunes of the oil industry unless there is an immediate coup and subsequent logic defying change of fortune.

Clarity On Issue #2 – Iran

The second reason for RayJay making such a big upward revision to oil price expectations is Iran.

The impact of sanctions is happening faster and is far greater than what was originally expected.

Originally RayJay expected sanctions to take a 200,000 barrel per day bite out of Iranian exports starting in 2019.

Instead the sanctions have already caused a huge reduction of Iranian exports and it has happened months earlier than expected.

Raymond James refers to recent data that suggests that Iranian exports in October are going to average a whopping 1 million barrels less than early 2018 levels.

And that is before sanctions have even started!

As a result Raymond James has lowered their expected 2019 Iranian exports by 500,000 barrels per day from their original forecast.

Given that we already experienced a 1 million barrel per day drop and that Raymond James originally modelled a 200,000 barrel per day drop – seems to me like they likely will need to increase that additional 500,000 barrel per day forecasted drop again in the future.

Which is exactly what Raymond James warns of in their report!

Be aware that since then, the US government has given exemptions to several countries to specifically help keep the price of oil low (especially before Tuesday’s US mid-term elections!)

Clarity On Issue #3 – IMO 2020

In 2020 (that is just 14 months from now… terrifying I know!) there are new rules coming into play for the global shipping market.  That may not sound interesting but trust me it is.

Those new rules are intended to reduce the amount of pollution produced by the world’s ships.

These rules were created by the International Maritime Organization (IMO). Starting in 2020 the IMO is going to enforce a complete ban on ships that use fuel that contains a sulfur content higher than 0.5 percent.  The current standard is 3.5 percent.

A ship in violation will be hit with fines, almost certainly find that their insurance become invalid and likely declared “unseaworthy” which would result in the ship being barred from sailing.

In other words, this rules are going to be complied with.  There really is no option.

The impact for the global oil market is that it makes high sulfur oil that is currently being undesirable.  In total Raymond James believes that IMO 2020 will “effectively” remove 1.5 million barrels of currently consumable oil supply.

Admittedly there is a lot of “guesstimation” involved here, but Raymond James thinking to get to that 1.5 million barrels being washed out is this:

  • There is 3.6 million barrels per day of high sulfur fuel oil in use today that will not be compliant as of 2020
  • RJ estimates that 750,000 barrels of this can be blended, desulfurized or slowsteamed so that it can still be used
  • Another 600,000 will be continue to be usable through scrubbers installed on ships
  • Another 800,000 will continue to be used by ships that manage to cheat the regulations

The remainder of that current 3.6 million barrels per day of high sulfur production (about 1.5 million barrels per day) will no longer be useful to anyone and it is going to happen the minute the calendar turns 2020.

It will be like a David Copperfield magic trick that makes 1.5 million barrels per day of production disappear – and it could happen overnight.

While this issue is still pretty much off-the-radar it will be a game-changer for global oil prices in 2020.

Again, the US government is trying to come to the rescue of oil consumers by asking the IMO 2020 group to ‘phase-in’ their targets to ensure that oil markets are not disrupted.

Global Inventory Levels Will Get Dangerously Low

Global oil inventory levels have drawn down by 370,000 barrels per day in 2018; RayJay sees this continuing.

Their view is that the draw will be 70,000 barrels per day in 2019, 500,000 barrels per day in 2020 (when IMO kicks in) and 260,000 barrels per day in 2021.

If accurate that is going to create a big inventory draw and that assumes $100 Brent in 2020.  If oil prices are lower the draw will be bigger.

They key number that the market will be focusing on is the number of days of oil consumption in storage.  A normal number is 30 days (the historic long term average).  We are already under that at 28 days as of Q3 2018.

The chart below shows how closely WTI follows inversely with the number of days of oil consumption in storage.

When we were under 30 days in 2013 and 2014 oil was $100 per barrel.  As the amount of oil consumption in storage rose WTI prices fell in 2015 and 2016.

2

When looking at the chart you could make a compelling case that oil prices should already be much higher than they are.

With their expected draws Raymond James current view has oil consumption in storage getting down to 27 days in 2020… a concerningly low level.

In fact that 27-day figure makes the firm wonder if they actually aren’t lowballing how high oil could go even with their $100 oil in 2020 call.

But what has happened since then? Just:

1. the single largest reported increase in US production in history
2. the US gov’t gave exemptions on Iranian sanctions
3. Libya and Nigeria have surprisingly increased production
And now the dominant meme for investors is global cyclical slowdown, and investors appear to be more worried about $50 oil than $100.

I’ve always said there’s always a bull market in energy – and right now it’s in volatility.

PS:  I watched RayJay call for a collapse in oil prices starting in late 2012, with very well researched data.  They were early, but they were right, and they were right for the very reasons they outlined at the time.  Time will tell.

WHAT WILL ENERGY STOCKS DO IN 2019?  Come hear Nathan Weiss, editor/owner of Unit Economics, in Calgary’s Hyatt Hotel on Monday November 19 as he outlines his case for energy stocks. You will also hear from some of the top junior producers in the Americas, with assets in Colombia, the Permian, and of course Canada.  This exclusive event has only a few seats remaining.  You can sign up here.

Keith Schaefer

My Greatest Winner of All Time Will NOT Be an Oil or Gas Stock

0

Back in 2016 there was no bid for oil stocks.

The sector was dead money — and I knew it.

So I went looking to make money elsewhere — specifically, downstream — in search of innovation and disruption in the energy markets.

What I found there was something very special — a microcap stock with a disruptive proprietary technology.

Over the last couple years, I have been patiently accumulating… and I now own 1.7 million shares. That’s 2% of the company.

I’ve been watching. Waiting……

I bring it to you now for a very specific reason. This company is hitting its stride. Revenue increases. Positive cash flow. Big Name Customers.

Let me tell you why.

The Second Half of 2018 IS The Inflection Point

Business for this microcap is busting out in Q4 2018.

The company has just signed major deals with multiple NASDAQ/NYSE listed companies. As a result the revenue growth from here is about to go parabolic.

What is really unusual and crucial for you to understand is that almost all of the customers that this microcap has on-boarded are Fortune 1000 companies.

That validates the technology of this micro-cap — and the company’s ability to sell it.

Equally important for investors… these deals are not priced into the stock of this company. With next to no analyst coverage, The Market has no clue what is going on here.

That will change. I have been paying attention, and that gives me — and now you — an information advantage on the pros and the rest of the market.

Tomorrow we won’t.

This Company Solves A $60 Billion Plus Problem

You could not believe how much inventory goes missing from US businesses in a year; accidents, thefts, absent-minded people… the losses are nothing short of APPALLING.

1

One study shows that in the United States alone at least $60 billion of inventory disappears every year (1).

But that study deeply understates the problem because it involves a survey of just 91 large businesses.

A better piece of data from that particular study is that those 91 businesses generated $845 billion in sales.  That means that $60 billion of lost inventory for those 91 businesses represents 7% of their total revenue.

That sounds bad, but the reality of the problem is much, much worse.

Consider that the entire net profit margin of an average retail business is under 5%. Yes, what I’m telling you is that American retail businesses lose more dollars of inventory every year than they make in total profits!

This micro-cap has the solution, and is selling it every month to Fortune 1000 companies.  It’s hiding in plain sight.

RFID Is The Answer – So Why Hasn’t It Already Solved The Problem?

Fifteen years ago Walmart made a major move aimed at trying to save the billions and billions of dollars that it was losing to inventory shrinkage each and every year — they would require its 100 largest suppliers to tag all shipping pallets with radio-frequency identification (RFID) tags.

It was a ground-breaking announcement.

2
Image Source: Fotolia.com

For the first time RFID technology would be applied as a business process. At the time, analysts estimated that all other retailers would quickly fall in-line with RFID spending expected to exceed that of Y2K — more than $100 billion!

The technology was meant to be a step change improvement from existing barcode and scanner technology. Barcode tracking requires the barcode tag to be directly in the line of sight of an electronic reader or scanner.  This is manual, time and labor intensive as well as limited in scope.

3

RFID promised to be very different with an RFID tag emitting a radio wave that can be read from hundreds of meters away automatically. No scanning, no people.

While Walmart’s RFID announcement was ground-breaking, what followed wasn’t. It turned out that RFID inventory management was not ready for primetime.

There were challenges yet to be overcome.

While the cost of barcodes was basically zero, the cost of RFID was much higher.

Where barcodes had been tried and tested for 20 years, RFID was brand new and flaws emerged.  The radio waves didn’t go through metal and were diffused by water.  The readers struggled to cover wide enough areas of space.

Long story short, with suppliers balking at the cost of installing the tags, the initiative fizzled.  Walmart completely abandoned its efforts to have suppliers comply with its RFID plan in 2009.

The RFID revolution was paused… but it was not dead.

Walmart was early, but not wrong.

We are now at the moment when RFID will be the solution that saves businesses tens of billions of dollars.

Since Walmart’s test, hardware costs of RFID have plummeted.  And RFID tags and readers now work over wide areas–the challenges of accurately reading wide areas have been addressed.

In the future we will recognize right now as the tipping point for mass RFID adoption.

The microcap company that I’m going to reveal to you is right at the center of this tipping point.

It is literally happening now…

Actual Business Results And Actions Are Telling The Whole Story

Technology doesn’t impress me; cash flow does. So here’s the story of an $8 billion NASDAQ-listed customer that has now installed this microcap’s RFID technology in over 70 locations across the USA.

That $8 billion NASDAQ listed company had an inventory tracking problem.

The company didn’t realize how big that problem was until a new key hire joined the business, took one look at things and said:

We need to adopt XXX’s RFID solution and do it immediately!

The inventory problem was typical of what all retail companies struggle with…

  • Inventory not getting to where it needs to be in a timely manner
  • Inventory being temporarily misplaced
  • Inventory disappearing entirely
  • Bloated costs of monitoring, transport and storage of inventory
  • Customer service shortfalls

This multi-billion NASD-listed company had a larger problem than they realized. But once our microcap company’s RFID solution was put to work, the problem was fixed.

The result was dramatically improved financial performance.

The $8 billion NASDAQ listed company’s inventory problems had worked against financial results in both directions.

Higher costs and lower revenues… double trouble.

But after installing this little company’s software… look what happened to its chart. The stock tripled.

4

And why is that again?

Because this company has made a step-change in its inventory management with our microcap stock’s RFID software — it’s now installed in over 70 locations by this one customer alone! This solution has helped to support higher revenues, lower costs and fantastic customer appreciation.

World Class Companies Are Now Coming To Them!

For a microcap company with a next-level technology solution like this, the hardest part is getting your foot in the door with a big customer.

In 2018 this microcap RFID stock got its foot in the door and then kicked it right off the hinges.  Not with one big customer mind you… with multiple Fortune 1000 companies.

It’s not just this $8 billion NASDAQ listed company: now customers… even BIGGER customers… are coming to this little microcap and signing up for its services.  More detail on one huge new customer win is coming….

The other thing I LOVE about this company… and this is key… the supply chain is rallying around the technology, and referring them business. In fact, the largest RFID tag companies (the hardware in this business) on the planet are becoming partners and sales channels for my micro-cap RFID company. It’s a win-win — these big corps get to sell their hardware, but they need this microcap’s full solution to get that sale.  This is the likely exit strategy. My Big Fear is it will happen too soon!

As I said, the proof is in the actual results. Customers are now flocking to them.

The coolest thing for investors is — this is a high margin software business that requires little spending.  That means that there is no need for more financing here. And when The Market knows you don’t need cash, there is no cap on the stock; it’s free to run as new contracts get announced.

Lots more cash, no new shares.

Do Not Ignore My Next E-Mail!!!

My next e-mail is the most important one that I have ever sent.

In that e-mail I’ll reveal everything you need to know about this microcap RFID stock.

My e-mail will detail everything that I’ve been a little coy about today, and you’ll understand why I own 1.7 million shares.

Here is what is coming:

One – Details of the new business win that this microcap just announced with a blue chip behemoth that has a $300 billion Enterprise Value

Two – The specific details of the $8 billion NASDAQ listed company whose stock chart I showed to you earlier

Three… AND MOST IMPORTANT – The name and ticker of this microcap RFID stock… an opportunity I believe so much in that it is the largest position in my family’s portfolio—1.7 million shares.

I expect it to be My Biggest Winner of All Time.

Remember….

The customer contracts are already signed, sealed and delivered. You will recognize every name I throw out at you.

More customers are coming to this company every day.

The Market is not watching now–but it will be!  This company’s growth and positive cash flow is not priced into the stock. And I firmly believe more contracts are coming… or why would I own 1.7 million shares?

That lack of market attention is going to change as those customer wins hit the quarterly financial filings.

The shifting of The Market’s attention means that this one is time sensitive…

So pay close attention to your inbox. Your 2019 portfolio could depend on it.

Keith Schaefer
Publisher, Oil and Gas Investments Bulletin

Oil’s African Problem

0

INTRO: I’m off to Africa for almost a month—to celebrate my new “empty-nest” status.  It set off a story idea for me—one that has largely gone under the radar, and is very bullish for oil prices.

U.S. shale production represents roughly 7% of global oil production.

On a daily basis we can read stories about the explosive growth of U.S. shale and how it is constantly a threat to investors and sustained oil prices.

Half way around the globe oil production in Africa represents a very similar percentage of global production.

But let me ask you this……..

When was the last time that you read a news story that told you how African oil production as a whole was doing?

Yes, me too.  The answer is pretty much never.

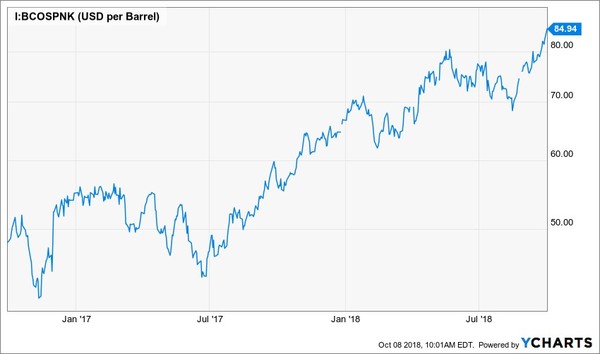
If the financial media were to spend a little time digging into the African oil production story they would be better able to explain why Brent crude prices are suddenly all the way back up to $85 per barrel.

And why those prices could be headed higher….

1 2

If U.S. Production Dropped This Much It Would Be Headline News

There are now seven different African countries included in OPEC.   I bet that none of the egghead contestants on Jeopardy could name them all.

I’m certain that the talking heads supposedly providing oil market expertise on the financial networks couldn’t.

In alphabetical order those seven countries are: Algeria, Angola, Republic of Congo, Equatorial Guinea, Gabon, Libya, and Nigeria.

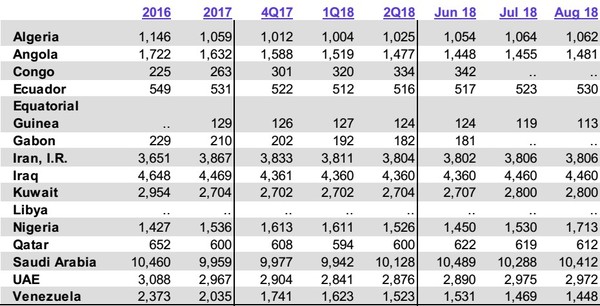
Production from this African OPEC contingent peaked in 2012.  At that time this group of countries were producing a combined 7 million barrels per day which accounted for 8 percent of total global supply.

At this 2012 peak these African countries were producing more than the entire United States.

Since then fortunes have changed.  While U.S. production has zoomed on the back of the horizontal revolution African production has struggled across the board.

From 7 million barrels per day in 2012 production from the OPEC African nations has declined by more than 25 percent —- now struggling to hold 5 million barrels per day.

2 2

Source: August OPEC Monthly Oil Market Report (MOMR)

It is an amazingly underappreciated story.

The threat to Iranian production from President Trump’s sanctions is not nearly as large as this 2 million barrel African decline…….yet the Iranian issue is a headline oil story while this African decline has gone virtually unnoticed.

The African continent has lost nearly as much production as the entire production of Kuwait or United Arab Emirates.  If either of those countries were to completely shut-off production it would be a major event.

This African production decline would be like production in the Bakken and Eagle Ford going to zero.  Could you imagine the panic if that were to happen?

Exploration & Development Spending Has Collapsed in Africa

Shale oil production is a different beast.  There is very little lag time between capital being spent and production coming on-stream.

Outside of shale though, the oil and gas business is very different.

Conventional production usually involves big projects that require multiple years of development before production kicks in.

When oil prices crashed in 2014 international conventional projects that were started before the crash were seen through to completion.  That has supported production globally over the past few years.

Spending on similar new projects was mothballed. The impact of that spending curtailment is really just kicking in now — especially in these African countries that have had oil production cash flows crunched.

Africa has already experienced a major production decline and there really aren’t any bright spots going forward.

Let’s look at the big four African OPEC producing nations:

Nigerian Security Nightmare – Africa’s Largest Producer 1.4 to 1.7 Million BOPD

While it isn’t quite the hot mess that Libya is, Nigerian production is not in good shape.

The security landscape is chronically unpredictable with regular production disruptions.  Total production doesn’t get cut in half overnight like it does in Libya, but hundreds of thousands of barrels or production are regularly offline.

3 2
Image Source: Telegraph.co.uk 

The Niger Delta Avengers method of operating remains the same —- frequent attacks targeting production platforms and pipelines including those owned by the likes of Chevron (CVX-NYSE), Exxon (XOM-NYSE) and Shell (RDS.A-NYSE).

Production in Nigeria which was well over 2 million barrels per day in 2012 now drifts around 1.5 million barrels per day.

With the dangerous environment discouraging large international operators to spend money–it is hard to see Nigerian production surprising to the upside.

With explosions a regular course of business, a downside production surprise is very possible.
Prediction – More production declines likely

Angolan Deepwater Depression – Africa’s Second Largest Producer 1.4 to 1.5 Million BOPD

Unlike many of the other African producers, Angola’s challenges are not of a security nature.  However, Angola is going to be ground zero for the impact of the post oil crash shutdown in deepwater spending.

French major Total (TOT-NYSE) just put its $16 billion deepwater Kaombo project on production.  After that though, the cupboard runs bare.

That is a problem, because as a purely deepwater producer Angola’s production declines at a pretty steep clip.  Not shale production steep, but deepwater production declines that aren’t supported by continual spending show up quickly.

There is nothing wrong with Angolan oil production that billions of dollars of exploration spending can’t cure.  The problem is that there isn’t anyone willing to spend those billions of dollars.

The IEA sees Angolan production falling below 1.3 million BOPD by 2023.  I agree.
Prediction – Continued production declines

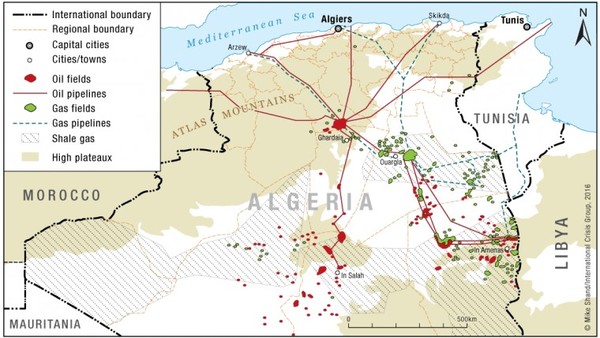
Algeria And The Red Queen – Africa’s Third Largest Producer 1.0 to 1.1 million BOPD

Relative to its neighbors–Tunisia and Libya which saw their governments toppled in the Arab Spring–Algeria has been downright stable as a country.

4 2

But the Red Queen never sleeps.

In Lewis Carroll’s classic “Through the Looking-Glass” the Red Queen warns Alice:

It takes all the running you can do to keep in the same place.  If you want to go somewhere else you must run at least twice as fast as that

That is the problem facing Angola.  The country’s oil industry can’t run fast enough to keep up with production declines.

Angola is suffering the long, slow, long-term decline that mature production always does.

Algerian production now at just over 1 million barrels per day is down 20 percent from 2012.  It isn’t volatile, but it is declining —- and it is not going to be heading higher.

Prediction – Continued production declines

Libya’s Oil Disaster – Africa’s Fourth Largest Producer–  200k to 1 Million BOPD

What can I say about Libya?

Since the fall of Qadhafi in 2011 Libya has been in a state of complete anarchy.  There is no producing region on the planet with production this volatile.

And there is no reason to think anything is going to improve.

The biggest challenge confronting Libya’s oil production is control of the country’s oil export terminals.  The control over those terminals has been switching back and forth between various militia groups — none of which are good news.

Every time one militia group takes control of an export facility from another it does so by bringing serious damage to the facilities during the siege.

And when it comes to actually drilling new wells in the country……forget it.
There is no international operator going in there both by choice and because there is no chance of getting insurance.

Prediction – Libya will continue to be a huge mess

$85 Brent Isn’t Close To Being Priced Into Oil Stocks

The rise in Brent crude prices has not been factored into the stock prices of many international producers.  Not even close.

These companies are trading at absurdly cheap valuations of cash flow and they are growing…….FAST!

No company is as cheap as my favourite Bakken producer in North Dakota.  I think it has the highest netback (netback=profit per barrel) of any producer I see right now in the USA.  And all these African issues will help keep global prices high.  I think their next operational update will be a HUGE catalyst for their shares….get the name and symbol of this oil gem right HERE.

Keith Schaefer
Publisher, Oil and Gas Investments Bulletin