China’s Huge Shale Gas Reserves — & How North American Energy Companies Can Profit

0

Chinese energy companies have spent billions joint-venturing North American energy assets in the last two years.  But the money pipeline could reverse under a new Chinese law—North American companies are now being allowed to develop shale gas in China—where natural gas prices are a LOT higher than here.

China recently designated shale gas as an independent resource, which means that smaller energy companies – possibly including some from outside of China – will be able to develop the resource in the country.  As yet, China has NO commercial shale gas—but big reserves.

China’s Ministry of Land and Resources did this to bring more firms into the sector, according to Reuters. The Asian country’s energy sector is currently dominated by massive Chinese companies like PetroChina.

Xinhua News Agency cited a government official as saying China would seek to launch a second round of shale gas tenders in early 2012—i.e NOW.

China only uses clean burning natural gas for 4% of its energy supply, compared to 20% + for most of the modern world—and it is already the third largest consumer of natural gas in the world (after USA and Russia).  They have a goal of getting to 10% by 2020.  China is increasing their gas supply now via pipelines from foreign countries like Turkmenistan, Kazakhstan, Uzbekistan, Myanmar and Russia.

Natural gas prices vary widely across the country, as they are subsidized in some areas to keep inflation low.  But in Shanghai you can now get $12+ per mcf and I have heard as high as $22/mcf—one of the best prices in the world (North American LNG export terminal proponents are salivating…).  Price liberalization is increasing.

Firms from outside of China will not be allowed to participate in the tenders but will be able to partner with the Chinese companies that win them.

This move could have major implications for any companies that partner with the winning Chinese firms as the Asian nation has an incredible amount of shale gas reserves.

The U.S. Energy Information Administration estimated that there was 1.275-QUADRILLION-cubic-feet-worth of “technically recoverable” shale gas in China. By comparison, the U.S. – which has led the way with the development of shale gas – has “only” 862 trillion cubic feet.

China has shown it’s eager to develop its energy resources—they’re on the record saying they want to increase oil and gas output by 23% by 2015 to 360 million tons equivalent—and to 450 million tons by 2030.

——————————————————————————————————————–

How To Get the Alberta Bakkenfor FREE: Follow this link to read my newest research, including a major new development for my #1 junior in the play.
——————————————————————————————————————–

In terms of just shale gas, China says it hopes to produce 229.5 billion cubic feet of the resource by 2015. By 2020, the country is targeting 2.82 trillion cubic feet of shale gas production, according to Reutersalmost a ten-fold increase in just five years.

Due to these enormous reserves, whatever foreign companies are able to partner with the winning Chinese firms will be in a strong position.

So far only the large Chinese firms have been winning bids to develop shale gas.

Earlier this month it was reported that China National Offshore Oil Corp, or CNOOC Ltd., which is the biggest Chinese offshore energy producer, began drilling its first shale gas project in the country.

Neil Beveridge, an energy analyst at Sanford C. Bernstein & Co. based in Hong Kong, told Bloomberg that this was a significant move for CNOOC.

“It may take more than five years for CNOOC to turn this exploration into real production, but the key message here is CNOOC signals a new direction on where the company will move in the future,” he said. “CNOOC will count heavily on unconventional oil and gas for growth down the road.”

Large companies dominated the first round of tenders in June.  This second auction will likely see smaller companies get involved in shale gas, due to the resource’s new designation.

Because of the challenges posed by recovering these unconventional resources, Chinese companies have been attempting to gain technical expertise by partnering with foreign firms to develop shale gas abroad.

One of the most prominent such ventures was Sinopec’s acquisition of one-third of Devon Energy Corp. (DVN:NYSE) for $900 million in cash. Bloomberg also reports that the deal could include the Chinese firm paying up to $1.6 billion in Devon’s future drilling costs.

“In these joint ventures, the partner does typically get some education on drilling,” Scott Hanold, an analyst for RBC Capital Markets, told Bloomberg.

The news provider reports that Chinese firms spent over $18 billion in 2011 buying oil and gas companies around the world.

China’s shale gas reserves are massive, as the profits for any company that is able to partner with a firm developing the resource in the country could potentially be.

by +Keith Schaefer

The 2011 Portfolio, Part 2 – and My Outlook for Oil Stocks in 2012

0

Each January I look back at last year’s trading and remind myself what cost me money. In Part 1, I wrote about what MADE me money.  In this article, I look at what decisions, what trading patterns, didn’t work out?  What lessons did I learn–again?

So what cost me money in 2011?

1.      BUYING PENNY EXPLORATION STOCKS IN THE OPEN MARKET.  I capitalized this because the best time, and one could argue the ONLY time, to buy a drill-punt stock is when it raises money; equity; issues shares to the public (or even better, to a select group of institutions).

These junior exploration stocks have BIG appetites for capital—especially the offshore drill punts where wells cost $30-$200 million, or the true penny stock companies trying to do expensive onshore resource plays, where raising money for a $5 million horizontal well can double the amount of shares outstanding.

The underwriters always win with these stocks; they will sell it down to get a good deal, or price, for a financing.  These guys are the pros; they know what the real value of the stock is.  They try to make sure their best clients, the buyside institutions who play the junior resource market, will make money on these financings.

Sometimes you and I—retail—get to buy these financings, and that is generally the best time to buy these junior, high-risk, high-reward plays. But sometimes retail gets cut out and brokerage firms rely on their analysts to be bullish (within reason now...;-)); stimulating demand and getting retail to buy the stock in the open market, and help ensure their institutions make money.

So instead, buy around the same time they do—whether you can get the financing or not.  There’s a good likelihood that will be the best price for a profitable trade.

2.      BUT—what ALSO cost me A LOT of money (on paper) in 2011 was not selling those financings I bought–once the stock traded below the financing price, or issue price as the market calls it.  THIS IS A HUGE LESSON I LEARNED AGAIN (I already knew this but like many mistakes, I learn it many times…).

My experience is that once a financing goes more than a few pennies below issue price for a couple of days—sell the stock; especially if it’s a “bought deal” financing, in which the underwriter/brokerage firm MUST buy the entire financing with its own capital.

I know there are experienced investors who would disagree with me.  But when the underwriters can’t hold the financing price (especially in a bull market), it’s a sign of weakness and I saw it happen this year with Xtreme Coil (XDC-TSX; XTCMF-PINK) and Tuscany Drilling (TID-TSX; TIDZF-PINK).  Once those stocks broke below the issue price, they fell DRAMATICALLY—40%-50%.

Now, I still own these companies as operationally, they are doing very well, and I think they’re going higher.  But my point is that a year after these financings, they are all still at least 20% below what I paid for them.

This is no different than having a stop-loss on your trading.  Generally I have a mental 20% stop loss on my trades, but on these financings it would be 5%-10%.

———————————————————————————————————————————————

No Oil Left Behind

Oil producers today finish drilling reservoirs knowing that a full 60% of the oil is still left in the ground.

Sometimes as much as 90% remains… despite using today’s most advanced recovery technologies.

One North American energy services company is changing that – in a big way.

Its patented technology literally extends the life – and profits – of oil wells.

And its stock could be the breakout play of 2012. To get the full story, simply follow this link.

———————————————————————————————————————————————-

3.      BAD DRILL RESULTS cost me money in 2011.

Now, this is the junior markets, and many stocks in which I invest live or die by the drill bit.  I do the research to find the good teams with good assets at good valuations, but they don’t all work out. And the important thing is I didn’t have a large amount of money in any one of these plays.

My sense from some subscribers is that they put too much money into the riskiest plays with binary outcomes—hit or miss.  Jackpot or zero.  That’s not how I build wealth in this kind of market.  There are really good bull markets in the juniors where you can sell your penny stock drill punts into a speculative fervour (think Sept 2010-April 2011), but they don’t happen every year.

Torquay Oil Corp. (TOC.A-TSX) had very little success in the field and their stock shows it.  It lost 85% of its value from its high.

Sterling Resources (SLG-TSXv; SGURF-PINK), Bengal Energy (BNG-TSX; BNGLF-PINK) and PetroFrontier (PFC-TSX; PFRRF-PINK) also had less-than-hoped-for drilling results which caused the stocks to have big drops from their highs in 2011.

4.      Lost Opportunity Cost–Waiting for stocks to come back or return to a price that I think I deserved to buy them at.  Out of the early October downturn, I was watching two market leaders—Legacy Oil and Gas (LEG-TSX; LEGPF-PINK) as a producer, and Canyon Energy Service (FRC-TSX; CYSVF-PINK) as a services play (they’re the leading junior fracking company in Canada).

As these stocks started to rocket out of their early October lows, I watched.  And watched. And watched.  I put a price in my head that I think I might be able to buy them at; that I deserved to buy them at. But with momentum, they just kept going up.

Sometimes it’s hard to jump on a moving train, but if you want to own market leaders, the bellwether stocks that the institutional money flows go to FIRST, and HARDEST, you just have to buy them out of the downturns—even if it’s for a quick 20% trade (and out of those severe downspikes, you really only want to own the leaders).

Sadly, I don’t own either stock right now.  They’re well managed companies with fantastic growth rates.  Too much thinking on my part.

5.      Buying high priced stocks that had a corporate miscue; or rather, not selling them right after a miscue (for some reason there is rarely just one miscue).  I actually prefer high valuations vs. low.  Expensive stocks generally stay expensive—the market rewards them faster and more heartily–and cheap generally stay cheap. Once the market pegs a stock as a winner or loser, it’s hard for management to shake that tag.

The big risk in buying a stock with premium valuation is that they have an operational mis-step and the market then gives them a standard or even a discounted valuation.

Xtreme Coil (XDC-TSX; XTMCF-PINK) experienced delays in getting its new, high-margin service rigs to market, impacting calendar Q4 2011 and Q1 2012 financials.  I like their position in the market.

They actually have a new MINING rig they are developing with a mining major for development drilling, but hasn’t been approved for commercial use yet.  The stock dropped 50% from my purchase price through the year.

LOOKING FORWARD INTO 2012

I’m actually quite excited about 2012.  The market and the world’s economies threw everything it could at oil, and the global oil price—which is now Brent, not WTI–had its highest average price ever, even more than in 2008.

Junior oil stocks and junior services stocks were not so lucky.  Despite great fundamentals, they lost investors on average about 20% last year, and many were down 50%.  I see that sentiment turning around the leading junior/intermediate plays are likely the trade of the year in 2012.  Valuations are low and oil prices—and service contracts—are high.

Despite the fact that 9 of the 10 top performing stocks in 2011 in the junior/intermediate oil and gas sector in Canada are liquid rich natural gas stocks, I am not tempted to go there—except for two that subscribers will hear about in the next couple weeks.

I continue to see oil in that golden range of $80-$120 per barrel, where exploration success and growth gets rewarded.  I think 2012 will see a lower average price for oil than 2011, but overall market sentiment and risk tolerance will be improved, lifting valuations.

Junior oil stock investors do NOT want to see oil over $120/barrel—history says we then have an INVERSE relationship between oil and oil stocks as the market prices in recession.

Canada is a good place to be right now — It has a fragmented junior market (meaning lots of little companies), the most transparent trading system/stock exchange in the world.

In Canada you get 8 cent stocks that go to 90 cents as well as $2.50 stocks that go to $15.

The charts on some of the leading Canadian intermediates are turning positive—notably Legacy Oil and Gas (LEG-TSX).

But a lot of charts are still negative. Interestingly the charts on the major US and Canadian service companies—Halliburton, Schlumberger in the US and Trican, Calfrac and Canyon Services—have broken out of recent downtrends, but are just moving sideways.

I told subscribers on January 3 I expect to be fully invested by third week of January in anticipation of a bull run…which has started. I expect it to last at least into March—our regular seasonal top.

I’m a position trader, with a goal of making 50%-100% on every single trade over a 9-18 month window.  But one last thing that cost me money in 2011 was not selling some of my positions (especially ones that did not have imminent catalysts) during this seasonal top last year.

Note to self: sell more at the top this year.

– Keith

P.S. Two days ago, in an interview with Fox News — I gave my views on the oil markets, how oil’s trading, and the situation in Iran. It’s a short segment – under 5 minutes and done via Skype — but I think you’ll appreciate it. Click here to watch the video on Fox News Online.

— 2011 PORTFOLIO TRACK RECORD DISCLOSURES —

48.2% average gain on closed trades — stocks sold in 2011
36% average gain on open trades — stocks initiated, or first bought, in 2011
36.7% average gain on open trades — stocks bought in 2009, 2010, and 2011

by +Keith Schaefer

The Risk & Opportunity in Precious Metals Stocks

0

By Dave Blais

Despite the recent bounce back in the precious metals sector in the past several days, I am electing to remain in an all-cash position, on the sidelines. As readers of my blog know, I sold all my gold and silver stocks before Christmas.

The reason for my stance is that I see the potential for significant risk ahead in the precious metals sector, especially the shares. Also, I have an idiosyncratic black-or-white point of view on investing in the precious metals shares — I believe they are an “all or nothing” affair.

That’s because my experience is a when the precious metals stocks are on the rise, they can provide outstanding profits. But on the flip side, when they are weak for an extended period, they can also deliver outstanding losses. In the last part of 2011, I was seeing signs that the sector may rise in the near term — but all those signs have since reversed.

In fact, I believe the risk that I see ahead is potentially great enough that it is prudent for me to stay in cash until the situation clarifies. Because I believe the potential risk in the precious metals market is high, I do not mind missing out on some potential upside in the meantime. If the risk I see fully expresses itself, then I see tremendous opportunity by getting back into precious metals stocks at what may be much lower prices down the road.

The potential risk

To review, here is what I see:

Gold (and silver) has been extremely weak in what is more often than not its strong season (November, December, January).  Despite the rebound in gold in recent days, for almost three trading weeks gold has remained below its 50-day, 150-day and 200-day moving averages — it is only in the last couple of days that gold has popped above its 200-day moving average.  Gold also remains below a three-year support line (the straight green line in chart below).  This previous support line can now be expected to act as resistance. The action in gold is poor — period.

To see gold (and silver) so exceptionally weak in what is usually a period of strength, I believe, is a potential warning that should not be ignored. To see such weakness in summer would be expected, as summer tends to be historically a weak period for the precious metals — but it is not to be expected in a period of seasonal strength.

Unless gold can quickly repair the technical damage it has experienced, gold is potentially opening the door to a much larger drop. By breaking below a three-year support line from 2009, gold increases the odds of being drawn to the lower boundaries of its current trading channel, which lie roughly at the $1400 area, then the $1300 area, followed by the $1200 area:

Of more concern, the HUI gold mining index may be replicating a very similar chart pattern that was present before the 2008 crash. The HUI has not yet definitively broken down from this pattern as shown in the chart below. (Several days ago it did break down, but it reversed the breakdown).

In the chart above, it can be seen that prior to the 2008 crash, the HUI gold mining index was supported by a key three-year trendline (orange line). Back then, just before this trendline broke, the HUI formed a “head and shoulder” type top that broke down, signalling the start of a devastating decline. An almost identical chart pattern exists today.

If a similar definitive breakdown occurs in the HUI now, I believe it could result in a possibly sizable decline for the gold (and silver) stocks in the near term.  Whether or not the decline would be as great as 2008 is not knowable in advance. And just because a chart pattern is similar does not mean will necessarily resolve the same way.

Nonetheless, the risk is the situation could turn into a real doozy to the downside, if a breakdown in the HUI occurs. The cause of such a decline would likely be an escalation of the debt crisis in Europe, causing another large wave of de-leveraging across the globe.

Given the potentially profound risk that I perceive, I prefer to stand aside and see how the situation resolves. On the downside, a definitive break of the HUI below the 495 level, I consider to be the trigger for a potentially bigger decline.  On the upside, a clear break above the 620 upper-level resistance in the HUI, in my opinion, would largely negate the risk to the downside, and give a potential “all-clear” signal to re-enter the market for gold and silver shares.

There is always more than one way to look at a chart. Below is an alternate view of the long-term chart of the HUI. This alternate chart shows a slightly different chart pattern replicating. If this alternate view is correct, a breakdown may have already occurred.

The purpose of showing this alternate chart is to explore possibilities. In any case, the message from both charts, I believe, is one of caution.

The HUI gold mining index isn’t the only chart looking dodgy. The Dow Jones Industrial Average is also looking a bit tenuous. Despite the positive action of the past few weeks, there is a potential “head and shoulders” top forming there as well:

In sum, the there are noticeable “echoes” from 2008 evident in the charts here and now. If these echoes resolve similarly in the weeks ahead, it could signal the start of a severe decline in the gold (and silver) stocks — and possibly other markets as well.

The opportunity, if such a decline in the gold and silver stocks actually occurs — could be life-changing for those who are prepared for it, and who patiently prepare to seize the opportunity such a decline would present.

In the 2008 smash, many quality gold and silver stocks were crushed beyond reasonable valuations. Those who were prepared by having a large cash position could have made a small fortune by buying near the bottom.

As an example, Novagold Resources fell from about $8 in the spring to well under $1 in the fall. (The actual low was below 50 cents, but few investors were actually able to catch the rock-bottom lows).

Once the bottom was in, Novagold over the next year rose to around $6, for a gain of more than 6 times. Had an astute investor bought Novagold near the lows, they could have turned a $50,000 investment to more than $300,000 in just a year. Two years from the 2008 low, Novagold rose to $14, which would have turned that same $50,000 into $700,000.

Novagold was one of the more extreme examples of the severe undervaluation that took place in the precious metals stocks in the 2008 smash, but it is by no means a unique example. Pull up the charts of almost any gold stock, and a similar story will be told. While I am not anticipating the same degree of mega washout as occurred in 2008 if the HUI breaks down, I am expecting that a another remarkable buying opportunity may present itself.

In 2008, what caused the precious metals stocks (and other stocks around the world) to fall below reasonable valuations was the extreme, rapid de-leveraging that occurred triggered by the failure of Lehman Brothers. This rapid de-leveraging caused individuals, hedge funds and others who used leverage or margin into forced selling. This forced selling caused more forced selling, and so on. In some ways, the 2008 episode could be described as a giant global margin call.

What if the gold stocks don’t break down, and reverse higher?

In standing aside here, I accept the possibility that the risks evident in the charts may not come to pass.  Indeed, many analysts believe that the precious metals sector has bottomed here and is poised to move strongly higher in the days and weeks ahead. That could very well happen.

If the market does not break down, and instead bolts higher, I will wait until the HUI gold mining index definitively clears key overhead resistance at the 620 level, before re-entering. In breaking above 620, the HUI will likely be signalling the next big leg higher is likely in the cards.

The bottom line for me is that I believe the precious metals shares are at an absolutely critical juncture — and I have positioned myself to preserve my capital while waiting to take advantage of whichever way the precious metals shares ultimately break — higher or lower.

Dave Blais is a full-time investor who specializes in quality gold and silver stocks. He writes on his blog, Epiphanies on Gold and Silver.

Disclaimers: Neither Dave Blais or Keith Schaefer are investments advisors; no part of this article should be considered personalized investment advice. As always, investors should consult with a licensed financial planner for help on their particular investment situations.

by +Keith Schaefer

A New Trend that Could Affect Natural Gas Pipeline Stocks

0

The stocks of natural gas producers have been hit hard by the low price and bearish outlook for the commodity. But a new report from Denver-based energy analytics company BENTEK makes me think natural gas pipeline stocks, pipeline MLPs and pipeline ETFs/ETNs in the U.S. could come under big pressure in the coming weeks.

And their stock charts are agreeing with me.

Bentek’s report — “West Absorbs Marcellus Shale,” and just released on Thursday — says that the northeast US, the most lucrative retail gas market in North America, can be fed mostly from fast rising natural gas production out of the Marcellus shale —  a “local market” for that shale deposit.

If fact, with so many new shale gas deposits—located all over the U.S.—now every market can be served with “local” gas, greatly reducing the need for pipelines. Dividend paying pipeline companies have been some of the best performing stocks for resource investors, but the shale gas supply glut may drag them down now as well.

“From a fundamental and market point of view, it doesn’t bode well for those (gas pipeline) flows to remain high, due to growth in eastern shales,” says Bentek’s Sheetal Nasta, one of the authors of the report.

“We have local supply to serve local demand, not just in the Northeast, but in the Midwest, with the EagleFord and Granite Wash plays. Local production will serve local demand and long haul pipes are losing favour because of that.”

That is not good news for companies like Kinder Morgan (KMP-NYSE) which just spent $4.4 billion on the new REX pipeline that goes from Wyoming to Ohio—or for TransCanada Pipelines (TRP-NYSE; TRP-TSX), with its main gas line from Alberta to Sarnia Ontario.  To their benefit, many of these companies have long life contracts that get them through market swoons.

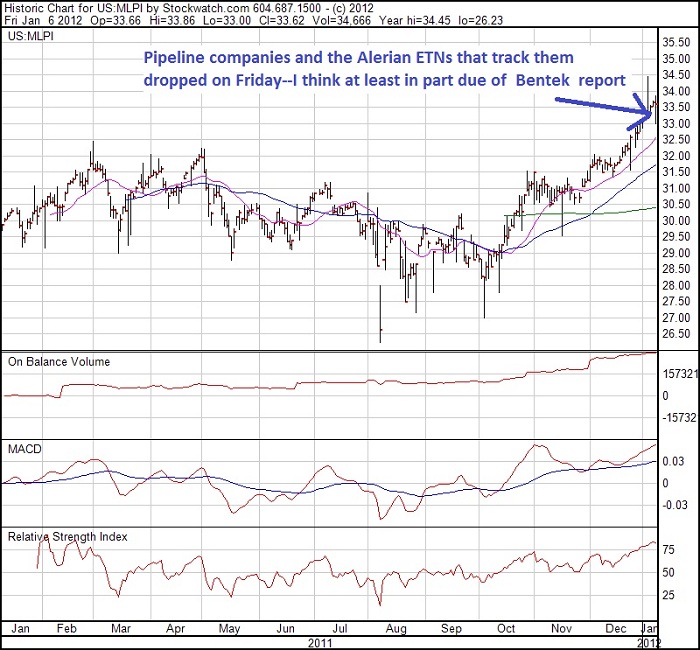
Pipeline stocks, ETFs/ETNs, and MLPs fell to their lowest intraday drop in months last Friday.  (MLPs, or Master Limited Partnerships, are tax-advantaged investment vehicles that make distributions similar to dividends; see our earlier MLP report here.)

The listings I saw affected most in Friday’s trading were the Alerian ETF and ETN products:

  • MLPL-NYSE—2x Leveraged Long Alerian MLP Infrastructure Index ETN
  • MLPI-NYSE—Alerian MLP Infrastructure Index ETN
  • AMJ-NYSE—JP Morgan Alerian MLP Index ETN

They were NOT textbook reversals on Friday, but they were larger than normal downdays. (Each of these 3 is down again today.)
MLPI 1 yr chart 2

Two of the largest pipeline companies in the US also broke stride with recent uptrends after the Bentek report came out. Kinder Morgan’s KMP-NYSE listing had its biggest intraday drop since the market crunch of early October. Enterprise Partners (EPD-NYSE), also had a large intraday drop, but it was not as unusual. (KMP and EPD are both down today.)

The reason pipelines exist is to take low price supply to higher priced demand. But the huge supply has depressed gas prices everywhere in North America, so there is little to no price spread on gas between the various hubs in the US. And for the first time in history, some price spreads have gone negative, says Nasta.

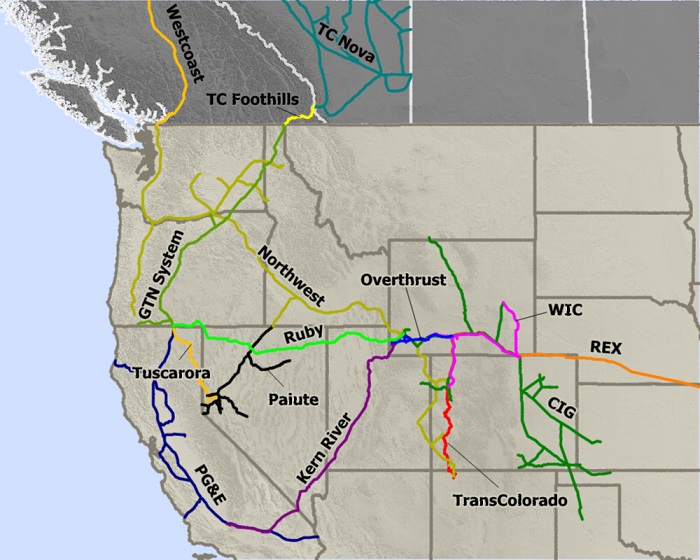
“Westbound flows on Ruby (the new Ruby pipeline moves gas west, from western Wyoming to Malin Oregon, on the California border) picked up in November and eastern REX flows dropped off (REX takes gas east, from eastern Wyoming to Ohio).”

The reason REX gas flows dropped was because of all the new gas production out of the Marcellus shale—the east just didn’t need near as much western gas.

“Demand in the west absorbed that incremental gas,” Nasta continues. “Due to a combination of mild demand in the east and increased production in Marcellus, prices on east side of the US (the Dominion South hub in Ohio) got really weak–and the spread between east and west went negative.

“That is historically unusual.  It wasn’t that long ago—a couple years–the price spreads between those two hubs were over $1 (per thousand cubic feet, or mcf).  But I don’t think it’s ever been negative.”

Pipelines US Ruby new 2

*source: Bentek GIS

“Spreads across the country are flat. We don’t need long haul gas.”

For high REX volumes to keep flowing, she says, the gap, or spread in prices between Wyoming’s Opal hub and Ohio’s Dominion South hub have to widen out again—meaning the western Opal gas price has to get weaker.

But gas production in the Wyoming area is flat; no growth. Combine that with increased pipeline capacity to get gas out of Opal—thanks to the new Ruby pipeline that just started in 2011—Nasta says she doesn’t see Opal’s gas basis falling much anytime soon.

So not only is there a lot of gas, it’s everywhere, reducing the need for pipelines, and that’s all coming at a time when a lot of pipelines have been built. Pipelines are like any other commodity; their pricing goes by supply and demand. It appears that local supply is going up and long haul demand is going down. Competition is almost certainly going to bring pipeline prices—the toll charges they give gas producers—down.

For resource investors, and income investors, pipeline stocks have been a steady to good performer. But if Bentek is right, I see their multiples—if not their actual dividends—being reduced if current trends in the gas market keep going the way they are.

Here’s a link to the Bentek report.

There is a Canadian angle to this story as well, which I’ll cover in more detail in an upcoming OGIB Free Alert.  Meantime, you can read my original story on how all the new US gas pipelines have displaced Canadian natural gas.  Click here for the OGIB report on REX – the Rockies Express Pipeline.

– Keith

DISCLOSURE:  Keith Schaefer is neither long nor short any of the companies mentioned above, and has no intention of initiating a position.

by +Keith Schaefer

The Oil & Gas Investments Bulletin’s 2011 Portfolio Track Record

0

My portfolio, which I use as the OGIB subscriber portfolio, finished 2011 up 48.2% on closed trades (stocks that I actually sold in 2011) and up 36% on open trades that were initiated, or first bought, in 2011.  If I include stocks I bought in 2009 and 2010, my gain on all open positions is 36.7%.

In all, gross gains in the portfolio totaled $449,744… while gross losses came to $52,860.

Strangely, the year didn’t seem that profitable, emotionally or mentally.   There was A LOT of volatility and angst—June and October were particularly harsh months for the junior resource sector.

And I was guilty at times of getting too wrapped up in the market swoons, trading out and trading in again.

HOWEVER — I did find what I think are my best trades of the year in the last two market bottoms in June and October—so I was able to use market panic to my advantage some of the time.

Each January I try to look objectively at my trading and track record and try to determine what I did right and wrong; what can I do better to bring more prosperity to me and my subscribers.

Here’s my list for 2011.  First, here is what made me money.  In my next article, I will share what lost me money in 2011 — and I’ll include my outlook for 2012:

1.      When I found a winner, I kept buying; averaging up.  In my four biggest winners of 2011, I continued to buy the dips as they rose—even after they doubled, I kept buying. I first bought Coastal Energy (CEN-TSX) at $2.50; I bought more in the June swoon at $8.80. Today, all those stocks are above the highest price I paid for them.  Now, when I do that, I listen to both the company and the stock; because sometimes they say different things.  My job is to do the research to see which one is more accurate.

2.       I did not average down on my losers—except one.  But my losing trades were obviously a lot smaller than the winners.  That’s because I don’t allow myself to believe that I’m smarter than the market.  If the market is selling a stock down, I always believe I have made the mistake and I start making calls to figure out what I don’t know.  I don’t say—”the market must be mad”—and start buying with both fists at lower prices—setting myself up for a BIG loss.   (My one average down stock is now back up to near-year highs)

————————————————-
This Company’s “Game-Changing” Technology Could Be One of the Great Success Stories of 2012
In fact this company’s share price is off to a quick start in the New Year… having shot up more than 50% inside the last 30 days.
Here’s why…
► Its technology is increasingly gaining acceptance in the marketplace…
Early-adopting customers are renewing their contracts (for up to 3 years)…
Its customer base is growing and diversifying.
That’s why I think 2012 will be a significant growth year for this small cap energy services company.
To learn how you can participate in the early going of this story, simply follow this link.
————————————————-
3.      I sold some of the more speculative stocks into anticipation of good results—I didn’t wait for the results.  I sold TAG a couple times just below $7 as the stock went sideways for a year.  I sold most of my Sterling Resources (SLG-TSXv; SGURF-PINK) before the news on its Cladhan oil well in the North Sea came out.  In 2010, Xcite Energy (XEL-TSXv) made me huge gains that way.

4.      When the market turned negative in the early spring, I was vocal about selling my juniors and moving upmarket, to higher priced, more mature and less risky stocks.  This made me more open to buying additional shares of my higher priced winners — even after they were already up.  (I could also argue that I didn’t sell enough of the penny juniors fast enough and that DID COST ME a lot of money.)

5.       This lesson did cost me money, but it saved me a lot more — Be flexible; be willing to say you made a mistake.  Normally when you make a mistake it means taking your initial loss and moving on—I was able to exit Valeura (VLE-TSXv) and being able to exit the position with only a 6% loss—it’s now down 70%.

But being able to change your mind also means having no ego on a stock that turns around–which you previously sold.  I sold two stocks this year that had horrible charts in a bad market—and days later, they each had something happen that fundamentally changed the company—for the better.  I jumped back into both—well above the prices I just sold them at — for the same reason I originally bought the stock, and they are both 40% higher now—within weeks.

I’m very happy with 48.2% gain in 2011.  But it could have been a lot better if I had practised a couple simple trading rules.  Sadly, even after 25 years of investing, I find myself making some of the same mistakes I made as a rookie.  I’ll tell you about them, and why I have a bullish outlook for junior oil and gas stocks (OK… just oil) — in 2012.

by +Keith Schaefer

How IFRS Accounting Rules Affect Oil Investors

0

New accounting rules in Canada are looser than before, making it harder for investors in oil and gas to understand their investments, and also more of a pain for Canadian companies to raise money in the United States.

That’s the conclusion I’ve come to after interviewing industry executives and national firm-accounting consultants in the oil patch.

“Find me a company in Canada that says we were able to raise more money at a better price with IFRS (International Financial Reporting Standards),” says Craig Nieboer, CFO at Canadian Energy Services (CEU-TSX).  “Find me an investor who can now say I understand this company’s financials better because of IFRS.”

“They don’t exist.”

This year, for public companies, Canada dropped its GAAP accounting system—Generally Accepted Accounting Principles—in favour of the IFRS—International Financial Reporting Standards.

During my interviews, I found the main difference between the two is that IFRS allows greater leeway for management and boards to use their own judgement in how to present and explain company financials.

In an era where the core financial sector of the western world is under huge scrutiny for lending and accounting practises, I found this odd.

“There are now more choices, so consistency between companies is impaired,” says Nieboer.  “For us, we have fewer lines in our statements so investors have to dig more in the notes and MD&A.”

“Has it improved better information to investors? At best no, and potentially it’s worse.”

Kevin Nielsen is a partner at Deloitte in Calgary, and works with a lot of energy companies.  I asked him to explain the switch to IFRS, and how it impacts both investors and management teams in the Canadian oil patch.

“IFRS is more “principles” based and therefore more judgement is required (by management in how to produce their financials),” he said in a phone interview. “Previously, GAAP was more rules based.  So as a result companies need to disclose in their financials more information on how their accounting policy choices are determined.

He said the new IFRS rules most benefit major international firms who operate in different countries and have different accounting practises.

For junior oil and gas companies in Calgary that have domestic assets, it obviously is not going to have the same benefit.

Stuart Symon, Chief Financial Officer at intermediate producer Angle Energy (NGL-TSX) in Calgary, says investors will have to do more digging to really understand a company with IFRS.

“You have to go to the notes in the financial statements to get the full story; read the disclosures. What’s happening behind the scenes? Is IFRS adding value to this equation? IFRS requires more disclosure that doesn’t necessarily provide incremental benefits for the reader.”

There are now more disclosures with IFRS. Management teams are trying to put the best information out there that’s the most relevant. But does the investor have time to read and understand it all?  Or does all that information drive investors back to the basics – the management team, drilling results and reserve report?

The Canadian accounting standard setters decided to move to IFRS as the majority of the world is doing so — even though Canada’s largest trading partner and largest source of foreign capital, the U.S., still uses GAAP, and there are no indications that they are moving to IFRS anytime soon.

Most changes that IFRS makes to oil and gas accounting happens below the cash flow line.  And being as most energy investors use cash flow as a primary valuation method, the IFRS changes should not have a major effect on corporate transactions, says Angle Energy’s Symon.

“We are not judged as much on earnings as we are on cash flow and recycle ratio. (Recycle ratio= field netback (profit) per barrel divided by finding cost per barrel–KS.)  So how much will this change how investors look at junior oil and gas companies? If you have an earnings emphasis, IFRS will change things, but oil and gas valuations do not tend to be as influenced by earnings.”

Here are some of the main changes that Nielsen, Symon and Nieboer say investors will notice in the junior oil and gas accounting under IFRS vs. GAAP:

  1. More impairments, or writedowns—and more frequent impairments in IFRS.  Asset values are obviously tied to commodity prices in this sector, so as prices move, the industry will not only see more writedowns, but lots of reversals in impairments.  “A writedown used to be viewed as negative in the market as it was rare,” says Symon. “People are going to have to get more used to impairments and reversals giving rise to earnings volatility.” The intent is to carry assets on the financial statements at a more current or real time market valuation.
  2. For service companies, one of downsides of IFRS is you don’t get true gross margin anymore, says Nieboer, as non cash items like stock based compensation and amortization are included as cost of goods sold.  “Gross margin is now artificially lower,” he says.
  3. Many more costs must be expensed, not capitalized, such as transaction costs when doing a deal, and even dry holes must be expensed, whereas before they could be capitalized.  For the small junior producer, a couple misses can mean a very bad income statement.
  4. All of the above points means there will be more volatility in earnings.  But few junior oil and gas companies have earnings.

No accounting system is a replacement for management integrity.  But with fewer lines in the financial statements being replaced by more detailed notes—facts being replaced with explanations—investors will now more than ever be on their own trying to determine what’s being said, and what is not.

by +Keith Schaefer

The U.S. – On Track To Become a Net Exporter of Oil Fuels, Once Again

0

For the first time since 1949, the United States is poised to become a net exporter of petroleum products, according to the Petroleum Supply Monthly report for November put out by the U.S. Energy Information Administration.

Through the first nine months of 2011, the U.S. exported 753.4 million barrels of gasoline, diesel and other oil-based fuels while only importing 689.4 million barrels.

America’s neighbors were far and away the biggest consumers of Yankee petroleum. Mexico imported more than 150 million barrels while Canada brought in slightly more than 64 million. The next closest country – Brazil – imported about 40 million barrels.

Jeremy Friesen, a commodity strategist at Societe Generale SA in Hong Kong, told Bloomberg News that part of the reason for the shift is that America’s consumption of oil has remained stagnant compared to the rest of the world.

“The U.S. has been flat or down for overall oil consumption versus the world, which continues to rise mainly due to emerging markets,” he said. “Latin American fuel demand continues to be pretty good.”

According to The Wall Street Journal, U.S. consumers used 7.7 percent less gasoline this August compared to four years prior, when usage hit its apex. In addition, the increased use of ethanol has depressed the consumption of gasoline.

While most experts are citing decreased domestic consumption as the driving force behind the reversal of the 62-year-old trend, increased domestic production is also playing a role.

According to the San Francisco Chronicle, production of domestic fuel products has gone up over the past two years in part due to the increased development of shale gas reserves.

One of the most prominent shale gas plays – the Bakken in North Dakota – saw gas production at 485 million cubic feet per day in September of this year, which is a more than three-fold increase over that figure in 2005, reports the EIA.

Expressed another way, the Bakken produced 424,000 barrels of oil equivalent per day in July, an 86 percent increase over the same month in 2009, reports the Journal.

Another domestic source of petroleum products that has taken off in recent years is the Eagle Ford shale in Texas.

According to the Railroad Commission of Texas, the first eight months of 2011 saw the play produce more than 8 million barrels of shale oil, compared to the about 3.76 million it produced in all of 2010.

Additionally, 2011 shale gas production in the Eagle Ford play through August reached 139 billion cubic feet, while the entire 2010 total was 108 billion cubic feet.

The increased production and dwindling consumption in the U.S., combined with eager international markets have worked together to put America in the position to be a net oil products exporter.

“Instead of that product backing up and depressing prices, it’s being sent to other countries,” Tom Kloza, chief oil analyst with the Oil Price Information Service, told the Chronicle.

According to some the U.S. will remain a net exporter of petroleum products for years to come, as the 900 million barrel figure the country imported in 2005 has steadily declined.

“It looks like a trend that could stay in place for the rest of the decade,” Dave Ernsberger, global director of oil with Platts, told The Wall Street Journal. “The conventional wisdom is that U.S. is this giant black hole sucking in energy from around the world. This changes that dynamic. “

OGIB Portfolio Returns for 2011: 48% average gain on closed positions; 24% average gain on open positions

Toreador’s Next Move: The ZaZa Merger and Eagle Ford Play

0

Environmental concerns about hydraulic fracturing are impacting shale oil and gas exploration all over the world—Canada, the United States, New Zealand—but none as much as France.

One year ago, the Paris Basin in northern France was one of the top international shale oil plays in the world.  And just like in North America and the Bakken, a junior player was the leader—Toreador Resources, TRGL-NASD.

How this world class play got developed was textbook geological sleuthing.  I wrote a full length story on it HERE.

Toreador’s stock ran from $5 last year to $18 in February this year before the French government took a fast and bold step to ban fracking country-wide—sending the stock to under $3.

How does a junior company survive such a mortal blow?  It’s a question more investors should be asking as environmental concerns surrounding hydraulic fracturing are having a bigger impact on community relations and speed/time of drilling programs.

Only three weeks ago the Environmental Protection Agency (EPA) in the United States suggested publicly that all fracking in the Bakken could stop next month—January 2012.   That was quickly shot down by the North Dakota senator the next day.

Down in New Zealand, TAG Oil shareholders were subject to local residents appealling their permit to drill wells—which will be fracked.  At the last minute, they said they could not afford to prolong their protest.

In the eastern Canadian province of  New Brunswick, citizen groups and environmentalists opposed to fracking have been blocking roads and staging demonstrations

The concern around fracking is real, and it’s global.

For Toreador shareholders, it meant an immediate and sustained hit to their wallets, with the stock losing 80% of its value in months.

For management, it meant speeding up their process of trying to diversify out of that one play—even though Hess was spending the next $250 million—and led to a merger with a larger private company with a surprisingly similar play in Texas.

Merger documents filed with the Securities and Exchange Commission in October show that  Toreador was already looking at ways to diversify the company.  Their stock price was rising, giving them good currency to do a big deal.  But nothing fit just right.

The French ban on fracking obviously made a second play a lot  more important.  You can try to produce a shale like the Liassic without fracking, but flow rates will be MUCH less than with fracking—and they would still have the steep decline rate regular shale wells have around the world.  It’s not the sexy production growth profile that would entice investors.

So after having in-depth discussions with several groups, Toreador’s CEO, Craig McKenzie, struck a deal with a private company, ZaZa Energy, which had some synergies with Toreador.  They too have a large joint venture with US giant independent producer Hess Corp. (HES-NYSE) – but theirs is in Texas.  And their joint venture is worth $3 billion, 10x what Toreador’s deal was.  ZaZa’s JV with Hess in the Eagle Ford covers 123,000 gross acres with Hess covering all costs related to land, drilling and completions.

Back in 2009 ZaZa’s owners – three seasoned Texas oilmen – and McKenzie’s team were each doing the same thing—getting started on a new frontier play and trying to find a JV partner.

Coincidentally, they both landed Hess around the same time; Hess signed its deal with Toreador about a week after signing with ZaZa.

According to recent filings, that merger should be completed this month, December 2011.  The new company will trade under the symbol ZAZA.  ZaZa gets 75% of the newco, but McKenzie will remain as CEO.

According to merger documents, by the end of 2013 the new ZaZa  will be looking at a combined production of 6000 boe/d, fully paid for by its JV partner, Hess. With production today at about 900 boe/d, that represents a six-fold increase in the near future, and an even greater increase in cash flow given the current price of oil and the fact that capital will be provided by its partner.

How do they get there from here? By combining an estimated 1,000 boe/d from the Paris Basin with nearly 5,000 boe/d from the Eagle Ford post-combination, plus any production they get from their 100% owned Eaglebine property—or other acquisitions.  By 2013, the new ZaZa will drill and complete an estimated 280 wells in the Eagle Ford alone—all paid for by Hess.

Hess will spend $2.5 BILLION in the next two years, before Dec 31, 2013, on ZaZa’s Eagle Ford shale properties. ZaZa entered the play early, grabbing 14,000 gross acres, and then adding 109,000 acres with Hess.  Hess can earn 90% of this by spending the money.  To date, ZaZa has drilled 25 wells and has completed approximately twelve in the Eagle Ford with a 100% success rate and the wells are producing above the industry average.

On top of that, ZaZa has 80,000 acres gross, 62,000 acres net, in the emerging Eaglebine play, which is really an Eagle Ford extension. The Eagle Ford started on the southern border of Mexico and has steadily trended north and east until reaching what is historically the Woodbine area.

Now the area is being relabeled as the Eaglebine as it heats up with Eagle Ford type activity.  There are multiple horizons for oil and liquid rich gas in the play.  ZaZa is an early mover in the region and is moving their first rig into the play in Q1 2012.

Production in the area ranges from 150-1350 bopd IP rates for oil, with most in the 600-1000 bopd range, and gas production as high as 19.2 million cubic feet per day IP rates.

The 6000 bopd target rate set by McKenzie doesn’t include any production from the 100% ZaZa owned Eaglebine lands.

Based on Toreador’s most recent corporate presentation, with nine conventional targets and three shales, the Eaglebine is probably more exciting to McKenzie’s team than the core acreage in the Eagle Ford.

Early drilling results in this emerging region are intriguing, with one vertical well only a mile from ZaZa’s acreage producing 900 bopd.  McKenzie has stated that once the companies are combined he expects to grow the Eaglebine position to 100,000 acres in the near-term.

McKenzie has also been clear with investors that his job is not done, post-merger.  With hundreds of small operators in Texas and limited capital, somebody like the new ZaZa can consolidate a lot of land and production.  McKenzie wants to be that Somebody.

The role of consolidator won’t come easy though.  Surprisingly, capital is still very tight in the Eagle Ford–and as companies’ leases expire over the coming years, many CEOs are desperate for funding.  Despite the hot play and 100% success rate in the Eagle Ford, investment bankers aren’t spilling their lattes from jumping all over E&P companies trying to give them money.  There is money available but it’s not cheap.

Because production in Eagle Ford is still young, and services supply is tight, that creates uncertainty.  ZaZa has distinguished itself as being a fast executor and it has all the agreements with the suppliers.  For any private small cap with expiring acreage, bypassing a traditional IPO by merging with a public company, as ZaZa did with Toreador, can be a good option.

As for France, the Paris Basin is now third in line for the new ZaZa.  At Toreador’s annual meeting this year, McKenzie said Toreador has identified 15 conventional prospects targeting 40 million barrels of reserves and will start drilling in early 2012.

Toreador also managed to extend its partnership with Hess to develop the Liassic resource.  Hess will be operating a one-rig, six-well program, beginning in 2012.    How the Liassic responds to horizontals without fracking will be the “tell” on whether this play can really get off the ground.

What’s been happening in France since the fracking ban is also interesting. The media has been asking, was the government too rash?  Is France missing out on something as the country now has a 19% unemployment rate?  The nuclear industry has aging plants and they recently experienced their first radioactive incident.  Rhetoric from the media and certain key politicians has been less rabid.

But until the French political will changes, it’s truly Texas Tea Time for Toreador.

– Keith Schaefer
Editor/Publisher of the Oil & Gas Investments Bulletin

DISCLOSURE: Keith Schaefer owns Toreador Resources

by +Keith Schaefer