COPPER PRODUCERS – THE GOOD AND BAD UPDATE

0

LB


Late last summer we published two blogs outlining the case for copper and copper stocks (here, and here).
What we said was:

  1. Yes, it is hard to buy copper stocks when they are down big (they were at the time) but…
  2. It is always hard to buy commodity stocks at the time you should be buying them.

We argued that if you could “look past the next 6-12 months” and “hold your nose” you would see a “massive tailwind for copper.”

We are now 4 months removed from those posts.  And you know what?  That “hold your nose” trade worked well.

Our copper stock list has significantly outperformed the market since those articles were published.

Picture1

Source: Yahoo! Finance

A 36% gain since July is nothing to sneeze at.


WHAT CAUSED THE RALLY?

 
The rally was not driven by anything company specific.  This was a move across the whole group driven by macro.

I’m not talking about “the economy is getting better” kind of macro.  We aren’t there yet.  But stocks move up well before the economic data gives us a good reason for it.

What we are seeing instead is a “hope” trade.  You never can tell if this is the hope trade, the one that will lead us into the next bull market.  But sentiment is always the precursor.

The improving sentiment on copper has led to an improvement in the price.

Picture2

Source: Stockcharts.com

Driving that sentiment has been China and the end of their COVID lockdowns.

With the re-opening of China, a new narrative has emerged.  Increased demand from China is hoped to offset weak demand from the developed world as it slows into recession.

There is reason to believe this could happen. China accounts for more than half of copper demand

What’s more, construction is ¼ of Chinese demand, so recent moves by the Chinese Communist Party to lift the property market adds more bullishness.   The construction sector has been the biggest headwind on Chinese demand.

Picture3

Source: BofA Global Research

Meanwhile inventories of copper across the globe keep falling and falling…

Picture4

Source: BofA Global Research

LME warehouses are down to only a couple of days of inventory.   The Shanghai warehouse is not much better.

While its tricky to estimate exactly what inventories are across the globe, it is safe to say that the number is lower than you’d like to see.


COMPANY PERFORMANCE HAS BEEN MIXED


And how have the companies we tracked performed?  Mixed at best.

Q3 results and the preliminary Q4 numbers have seen more misses than beats.

Costs were up across the board on the back of higher energy prices, higher chemical prices, and higher labor costs.

Add on a floundering copper price (under $4 for since Q2), and cash flow has been lackluster.   Forward analyst estimates have trended down.

Picture5
Source: BMO Capital Markets

You simply can’t attribute the relative outperformance of names like Capstone Copper (CS – TSX) and Taseko Mining (TKO – TSX) to their operating results.

Instead, what has driven relative performance has been largely about events not tied to their operations.
Here is a summary of 4 names that did have significant events over last 4 months:


CAPSTONE COPPER – THE PROMISE OF STABILITY

 
The biggest outperformer of the group has been Capstone Copper.  Capstone is up 86% since September.

The reason?  Likely an analyst site visit in November that reassured investors, in particular that Capstone’s big development project is on track.

Mantoverde is Capstone’s next big growth driver.  The expansion project is expected to add 70 kt per year of copper in 2024.

What Capstone told investors at the site visit was that Mantoverde was on schedule and budget – and that it is 69% complete.

Canaccord said after the visit that they now viewed a capital cost overrun as unlikely.   Given the blow up in costs at other projects, this reassurance likely put a bid under the stock.

As a result, we now see 2024 production growth from Mantoverde getting priced in.

Picture6
Source: Capstone Copper Investor Presentation

Capstone 2024 cash flow per share estimate (once Mantoverde is fully operational) is $0.98/share on $3.40/lb copper.  While the share price makes the stock look expensive on today’s numbers, it is less pricey if you look ahead.


TASEKO MINING – A DESTINATION IN SIGHT

 
Taseko Mining was the second-best performer on the list.

When I wrote about Taseko in September, I noted two points.

First, they needed to show a turnaround at Gibraltar, which I felt was likely.

Second, the BIG question was their development project – the Florence project in Arizona – raising capital for it and getting it through regulatory hurdles.

Taseko delivered on both points, but it was Florence that drove the stock.

In December, Taseko signed a strategic partnership with Mitsui to develop Florence.   Mitsui committed $50 million in exchange for a royalty of 2.67% of copper produced, which will be paid for at 25% of spot.

Mitsui can invest another $50 million for a 10% interest in the project.

While the stream adds about 7c/lb to the cash costs of the project, the funding and vote of assurance from a large player added a lot of credibility. 

Taseko followed it up with a commitment in January from Bank of America (BAC – NYSE) for $25 million to fund capex costs.

Together that is $75 million of funding ($125 million if Mitsui exercises their option) for a project with a $230 million capital budget.

We are still waiting on the final Underground Injection Control (UIC) permit for Florence from the EPA, which will be the make-or-break moment for the project. 

The market is signaling that the deal with Mitsui and funding from BofA are signs that the project will be a go.


COPPER MOUNTAIN MINING – MORE HICCUPS

 
Copper Mountain Mining (CMMC – TSX) has had a lot of news (both positive and negative) in the past few months.

The news on average seemed to balance out.   The stock slightly under-performed the group average.

In my last blog I called Copper Mountain “the poster child for operational risk”.

This turned out to be prescient.  Copper Mountain struggled to turnaround their Copper Mountain Mine.

Q3 2022 results were just plain bad.  The 13 million pounds of copper produced was less than Q2 and less than already reduced analyst estimates of 15 million.

Cash costs ballooned to $3.70/lb while all-in-sustaining-costs (AISC) were well above the price of copper at $4.50/lb.

Picture7
Source: Copper Mountain Mining Q3 Results Press Release

The stock price would have been a disaster had it not been for the good news: Copper Mountain announcing the sale of their Eva Project in Australia.

Eva is a late-stage project with high capital costs (estimated at A$850 million in the 2020 feasibility study).  Given Copper Mountain’s modest market cap (~$400 million) financing Eva always seemed like an exercise in dilution to me.

Instead, Copper Mountain sold Eva to Harmony Gold Mining (HMY – NYSE) for US$170 million of cash and contingent consideration that could be another US$60 million.

This seems like a great deal.  It removes the overhang on financing and – I suspect – sets up Copper Mountain as an acquisition target.  Now if they could just get that mine back on track…


FIRST QUANTUM – gamblers only

 
First Quantum Minerals (FM – TSX) underperformed the group, registering a 28% gain versus the group average 42%.  But quite honestly, I am surprised it didn’t do worse.

This has nothing to do with operating performance.  First Quantum Q3 was pretty much inline with expectations.

Instead, the big news was an unexpected tax claim by the Panamanian Government.

Panama is home to the Cobre Panama mine, which accounts for $18 of First Quantum’s NAV and over 50% of its EBITDA.

While the details of what exactly is going on is a bit sketchy, the long and short of it is that the Panamanian Government wants First Quantum to pay more taxes – including an “exploitation fee” for copper extracted in prior periods and a much-increased tax rate going forward.

While this news was known for much of H2, the prevailing sentiment seemed to be that it would get sorted out.  

That turned out not to be the case, at least not yet.

On December 16th news was reported that the Cobre Panama mine had actually halted production after a deadline for agreement between First Quantum and the government came and went.

This was subsequently clarified by First Quantum.  They said that the mine was still was operating, but only because First Quantum was using legal recourse to avoid a shutdown while they continued to negotiate with the government.

On January 10th First Quantum had a conference call where they again corrected media reports – this time ones claiming that talks with the government had broken down – but also acknowledging that a resolution had not been reached.

The bottom line is no one knows how this plays out.

We can be sure First Quantum will pay more taxes.  How much is unknown, as is whether this will this escalate to the point where Cobre Panama is forced into care and maintenance?

I have no idea, but I am confident that with the stock up 20%+ in the last few months, that outcome is not priced in.

I would wait this one out until we have a firm agreement between First Quantum and the Panamanian government in place.

TOP FUND MANAGER IN 2022 TALKS STRATEGY FOR 2023

0

This guy has my vote for Fund Manager of the Year.

2022 is one of the worst years in history for stocks—yet Rob Mullin continued his winning ways for investors in his Marathon Advisors hedge fund.

Mullin’s fund–it’s called the RAEIF, which stands for Real Asset Equity Income Fund—had a phenomenal year (3rd year in a row) and is one of the top performing strategies in the world over the last 1, 3 and 5 year periods. (due to quirky US securities laws,  I cannot provide Mullin’s specific–and impressive—performance data for his hedge fund unless everyone of you readers were accredited investors!)

But trust me, his market savvy and performance make him worth listening to–and below, he shares some of his best ideas for 2023.

His mandate at RAEIF is to find yield through dividend paying stocks in the resource sector.    

Mullin uses a broad combination of long and short trades, with option trading of both puts and calls, plus all those dividends to create a portfolio that has given remarkably consistent returns through 2022, increasing the fund’s value roughly 20-25% each quarter.

Considering that commodities and resources is one of the most volatile sectors of the market, that’s impressive.

Mullin says that resource producers have been “demonized” by mainstream investors, and that means they are trading at some of their lowest valuations in history.  That makes for very high yields—high single digit often double digits—despite low payout ratios.

In 2021, fund managers just needed to buy oil stocks to have a good year.  They went from pricing in bankruptcy to being the single largest cash cows in the S&P 500.  But oil producers’ stocks have been flat since March.

In fact, much of the resource sector stalled out at the end of Q1, and Mullin said he had to get nimble, and quickly—weighting his RAEIF LP to the short side in a hurry.

I’ve known Rob for 15 years, visiting him in his San Francisco head office whenever I was in town, and hearing his thought process on the Market at the time. 

But he really came back on my radar in early 2020, when he pulled off an incredible trade—buying “put insurance” for the Market just in advance of the COVID meltdown.  Every other fund manager (except Bill Ackman; same trade) lost huge, but Mullin’s well-placed insurance markers made his year.

His fund has been open only to American accredited investors, but in November 2022 he set up a fund that TROW—The Rest Of the World—can now invest in, to take advantage of his expertise.  You still have to be an accredited investor though.

I’ve convinced him to speak to our paying subscribers once a quarter through 2023.  But he agreed to share his strategy and some stock picks for 2023 with us today:


1


Keith: Rob, you had a great year, congratulations.  But let’s look forward now.  How are you positioning yourself for 2023:

Mullin: Well, a lot of the stuff that I’m buying is actually a heck of a lot closer to its 52-week lows, than it’s 52-week highs.
 
Where I’m looking, there’s still a lot of opportunities that aren’t pressing high valuations, not up 50, 150% year to date. So that’s really where I’m focusing.
 
Keith: Do energy stocks fit into that at all?
 
Mullin:  Yes. So in the energy patch, I think the global integrated oil energy companies are really interesting. You look at things like a Petrobras, (Brazil’s NOC—national oil company) which trades a US ADR (symbol PBR-NYSE).
 
Or an Ecopetrol, (Colombia’s NOC, national oil company) which trades a US ADR (symbol EC-NYSE). These are global $20 to $60 billion market cap companies, trading at two and a half times earnings, with 20 plus percent dividend yields. And yes, I understand that there are some political things that happened in both Colombia and Brazil, respectively.

1

 
Ecopetrol was an $18 stock in March. It’s a $9 stock today, and it’s $18 billion in market cap, earning $2 billion a quarter. You look at Petrobras, a $65 billion market cap, it’s paid off almost $80 billion worth in debt. It may be the greatest pay down of debt in the history of any company in the world. I mean, we’ve never seen anything like it
 
And again, this is a $65 billion market gap company, that made $9 billion in earnings last quarter. So it produces more oil than Exxon does. Exxon’s got a $450 billion market cap, this is a $65 billion market cap.
So to me, those are really interesting opportunities that offer a lot of asymmetry.
 
Keith: There’s so many different—and big—macro currents right now in the Market.  Will the US Fed pivot or not pivot, COVID in China, the Ukraine-Russia war, COVID supply chain issues etc. When you look at 2023, what would be one of the top two factors that’s guiding your macro thinking.

Mullin: What I’m trying to do is kind of strip out the noise, and really listen to, what are resource inventories telling us? What are inventories telling us about the global economy, on the margin?

And to me, what that is telling me is that demand remains fairly firm. You look at what has happened to oil inventories in the last three or four months. They’ve been fairly steady, they’re not really building, they’re not really coming down. Oil prices have come down a lot, but oil inventories have been pretty flat.

That said, you strip out the impact of the SPR releases, which have added about 350 million barrels to global inventories, global inventories continue to fall really rapidly.

So that backdrop to me, on energy, just seems really robust.

To me, a big part of the reason why oil prices have come down, is because of the massive financial liquidation of oil. You look at the speculative traders positions, the CSTTC reports, and areas where you look at where managed money…you’ve had a selling of financial barrels, but the underlying inventories, which is what I think we should be really listening to, tell you that the underlying demand story is pretty good.
 
And a related sector is oil tankers, though I call it tanker and infrastructure sectors. I think there may be a case here to pivot back to the bulk shippers, the ones who do iron ore and grains, and things like that. Those stocks have been beaten up pretty good. They’re sort of back again, back a lot closer to their lows than highs. Some companies in there have some pretty substantial dividend yields.

Keith: Any favorite stocks there?

Mullin: So, my favorite in the bulk guys is Star Bulk, SBLK-NYSE. That’s, in all likelihood, call it a $20-ish stock that’s going to pay something close to $4 in dividends, in 2023. So that’s right up my alley. It’s reasonably large, it’s liquid.

2


Keith: As I read your quarterly letters, you talk about all ELEVEN sub-sectors of resources that you follow.  What are two of those 11 you like in 2023.

Mullin: Sure. The Ag space—agriculture—is one. I would say that even before Ukraine, the higher fertilizer prices were causing farmers to cut back on fertilizer applications.

That’s going to start showing up in yields over the next three to six months. I think inventories are going to tighten up considerably, and I think the big risk that we run is going into a 2023 where we’re seeing a lot more in the way of resource nationalism, which I’ve written about a little bit.

That’s where those countries that typically have surpluses, and the ability to export those surpluses, may be less inclined to make those surpluses available to importing countries.

If we continue to tighten up on inventories, like we have been over the last year or two, I think there’s going to be even less of an inclination to share, which when you tighten up the marginal bushel, or marginal barrel, whatever it is. That’s when prices tend to sort of surprise, to the upside.
 
And then, one other sector for 2023–I actually like the gold space. I think we are seeing, as the Fed marginally moves towards a more flattish outlook, they’re still going to raise, maybe they don’t cut aggressively. But the pace of tightening is going to go down.

It seems like this relentless dollar rally has sort of lost its steam. I’m not saying that highs have been made for USD, but I think we’re kind of in the ballpark. For that reason, I think gold’s performance this year has actually been pretty darn good.

Particularly if you look at it outside of the US dollar, in most other currencies around the world, it’s actually up this year. In some currencies, like the Japanese yen, it’s up a decent chunk.

The fact that gold has held in, despite again heavy financial liquidations, is impressive. Gold ETFs suffered 22 straight weeks of outflows, up until last week. Late November saw the first inflow in 23 weeks.

So you’re starting to see some of this financial demand sort of reverse. I think the physical markets are going to remain relatively tight. Gold stocks have started to rally a little bit, the bigger caps have come up a little bit more.

The smaller caps are still lagging, but they’re sort of coming off their lows. They’re inexpensive stocks, lots of them with kind of reasonable dividend yields, high free cash flow generation.

If you look at them as I do, compared to the valuations over the last 25 or 30 years since I’ve been doing this, I’m not sure I’ve ever seen the gold stocks, in aggregate, at a cheaper price to cash flow, price to free cash flow, price to NAV on strip, than I see them right now.

And so I think it’s sort when everyone has given up on them for being dead, is exactly the time where I want to be sort of kicking around, and looking to position myself in them. So that’s another area.
 
Keith: that’s great color, thank  you.  So what’s a stock in that sector you like?
 
Mullin: Well, I like Sprott—SII-NYSE and SII-TSX. So here you get the benefits of the gold play, but you also have uranium funds, you also have others.

3


Sprott has traded around this $30 level, when it had $6 billion in AUM (Assets Under Mgmt), when it had $16 billion in AUM. Now it has north of $20 billion in AUM. It’s still right around $30 per share. And so, again, I love places where you’re building convexity and not paying for it
 
And there’s actually good precedent for that. The same thing happened back in the 2002 to 2007 gold bull market, one of the best performing stocks from 2004 to 2006 US Global Investors (GROW-NYSE), which was the Sprott of its day, in an environment where the GDX went up 50 or 60%, US Global went up tenfold over those two years. So there’s precedent for this, and I think we could see something like that again.
 
Keith: Rob, any final words of wisdom you have for resource investors in 2023?
 
So over the top of all of this, investors need to be cognizant, that this is not going to be a straight run. I think that if 2022 taught us anything, none of this is going to come easy.

We as resource investors do not get to have the great technology, healthcare, sort of up and to the right, where you can just lever along and ride it for four or five or seven or 10 years. It just doesn’t happen in our sector.

The nature of resource bull markets, which I’ve said a number of times, is that the fact that commodity prices are rising and inflation expectations are rising, that causes a lot of instability in the broader markets.
 
The resource cycle doesn’t end until the capital is spent to bring on enough supply, to make it end. If all the politicians and bankers and management teams were able to raise the capital required to produce more oil, more copper, more nickel and more lithium–we would still be five to seven years away from really seeing a meaningful uptick in that supply.

That money to create that extra capacity was not spent in 2016 to 2022 and it’s not being spent now.

So I think it’s really early. The real resource cycle doesn’t end until late this decade, if not even later. We can have volatility and phases within the cycle, but we have years to go here I think.  So that’s where I think we are.
 
Keith: Wow, that’s powerful! Rob thanks for sharing your thoughts and congrats again on an amazing 2022, and look forward to catching up in early 2023.
 
Mullin: I appreciate your interest Keith.  Merry Christmas.

EDITORS NOTE–you can connect with Mullin on LinkedIn at https://www.linkedin.com/in/robert-mullin-58422b84/


Keith

MAKING SOLAR INVESTING A “NO-BRAINER” FOR RETAIL INVESTORS, AND THE BIG BANKS

0

Solar stocks have the potential be No-Brainer investments.  In Canada, provincial governments are giving them incredible tax breaks so they start to spit out Free Cash Flow very early in their 20-25 year project life.

And that’s just to mostly—but not all the way—catch up to how many big tax breaks the US is giving them.

There is a HUGE political will for solar to succeed, so you have to make them No-Brainers. Both Canada and the US have just increased tax credits and accelerated depreciation to get more solar projects built.

My job is to go find some good management teams in junior public companies who know how to access this non-dilutive capital and make their shareholders very very happy!!

Of course, increasing solar power capacity is good for the environment/climate change etc. In fact, the only bad part—and it’s not really bad—is that the banks get to win yet again.  The (much) smaller solar developers win too, but as I’ll explain, the banks really make out here. (I just like The Little Guy to win a lot, you know?)

Before I get into all this, understand—solar can be profitable without tax rebates.  But tax rebates take solar from ‘that’s an okay return’ to ‘this is a no-brainer’!

Which makes sense, I guess.  If you want to drive investment into renewables, if you want exponential growth, you want a no-brainer.

In the most un-technical of terms, this is what the government has done.


IT’S ALL ABOUT FAST PAYBACK
FOR THE BANKS AND SOLAR DEVELOPER


I am going to keep this simple. There are two main contributors to tax breaks for solar projects in the United States and Canada:

  1. Investment Tax Credit
  2. Accelerated Depreciation

The intent of both is straight-forward: Recover the costs of the project, and do it FAST.

If you recall from my prior post, the #1 thing to know about solar is how big the capital costs are.

Paying back capital is what limits free cash and free cash is what determines if a project gets built.

The government recognizes this and is here to help.   How?   By essentially paying for 30-40% of the cost themselves (by not taking taxes).

In the United State the result as much as 40% of the capital cost comes back.  In Canada it is a bit less because Canada’s accelerated depreciation is a little more drawn out.  But either way it is a big benefit.


#1 REBATE: THE INVESTMENT TAX CREDIT

 
How does the government do this?  For one, with the investment tax credit (ITC).

This credit has been around in one form or another since 2006 in the United States.  It was supposed to be tapered off, starting in 2020.   No more: the recent Inflation Reduction Act (IRA) entrenched it for the next 10 years, which will give solar (and wind) a long run-way.

The ITC gives a tax rebate equal to 30% of the capital cost of the solar project.  For a $300 million project, the ITC allows the owner to deduct $90 million of it.

I was surprised to learn that until this year, Canada did not have an ITC of their own.  But now that has changed.   This fall Canada met the ITC with their own Clean Technology Investment Tax Credit.  Like the ITC, the credit is for 30% of capital put towards renewable energy generation and storage.

Obviously, a $90 million rebate on a $300 million project is a big deal.  But it is made much more of a big deal by the way the government lets you use it.


ITC TRANSFER-ABILITY

 
Let’s start with the basic premise that a tax rebate is worth more the faster you can use it.

If you are a solar company, you may not have a lot of taxes to offset.  It may take you 5 years to use $90 million of tax rebate (in other words have $90 million of profits to offset).  Maybe more.

Enter the transferability of the ITC.   With it, comes the invention of solar tax equity financing.

Solar tax equity is matching a solar project with an equity investor who has a tax liability they can offset right now.

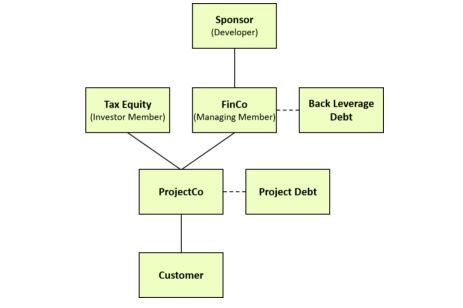
The structure usually looks something like this:

1 2

Source: Woodlawn Associates

You have a solar developer, a tax equity partner, and usually some other financing partner that lends the rest of the money (they aren’t very important for us right now).

Together these parties form a “ProjectCo”.  The ProjectCo is where the solar project lies.

The whole reason for the structure is to let the tax equity partner benefit from the taxes.  While you, the solar developer, still own the project.

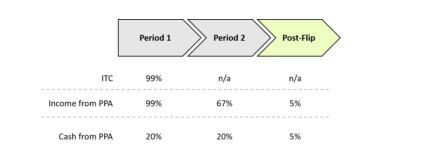
How does it work?  The ProjectCo is structured to let the tax equity partner take 99% tax ownership for the first year, the year when the tax credit is realized.

Every structure is different, but they usually look something like the table below, which shows the economic interest of the tax equity partner over time.

2 2

Source: Woodlawn Associates

For the moment, focus on the ITC row.  The tax equity partner gets 99% ITC ownership for tax purposes in the first year.  In other words, that entire $90 million rebate is their write-off.

What do you get as solar developer?   The tax equity partner funds some of your project.

For our $300 million solar project, the tax equity partner may finance $85 million (give or take) in return for the tax credit of $90 million.

Not bad.  But that is just part of it.  The tax equity partner will likely finance even more.  I will get to that shortly.

But first, who is this tax equity partner?


THE BIG WINNERS? THE BANKS (OF COURSE)

 
Well, the banks aren’t the only big winners here (the solar developer wins too, as does the environment).  But it never hurts the ole page views to make the banks look like the bad guys.

The most common tax equity partners are the banks.  In the United States the 3 biggest partners in tax equity are Bank of America (BAC – NYSE), JP Morgan (JPM – NYSE) and Wells Fargo (WFC – NYSE).

It makes sense.  Banks virtually always make money.  They have lots of taxes to pay.   They are happy to share a ~10% return.  They have the back-office to handle complicated structures and the capital to make large short-term loans.

The takeaway here is that this is all done to realize the tax credit as fast as possible.  Because the faster it is realized, the more money it is worth upfront to the developer.


#2 REBATE: UPFRONT DEPRECIATION

 
The second tax rebate is accelerated depreciation.  Companies in the United States can depreciate 85% of a solar project in the first year of operation (Canada has something similar, but the depreciation is over two years, not one).

In both the US and Canada, this isn’t a new credit; it was introduced in the Tax Cuts and Jobs Act of 2017 in the US and has been around since 2005 in Canada.  The recent IRA in the United States extended the credit to apply to renewable storage and hydrogen projects.

Upfront depreciation can be a big benefit to developers.  Like the ITC, it takes advantage of banks as partners.

Back to our $300 million capital solar project.  The ITC effectively lowered the price tag by $90 million.  Now, because of accelerated depreciation, 85% of the other $210 million can be depreciated in the first year of the project ($178.5 million).

In order to take full advantage of this, the solar developer partners likely deal with that same bank that gave them ITC funding.

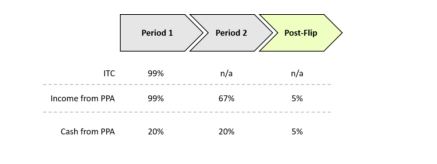
Below is a re-post the chart I gave above, showing the structure of the partnership.

3 2

Source: Woodlawn Associates

We already talked about the ITC, of which the tax equity partner gets 99%.  But you’ll notice that the tax equity partner is also getting 99% of the income from the project in the first year.

Why?   So that they can benefit from the accelerated depreciation.  (In Canada the structure is all the same except it’s over two years, not one.)

Here is the benefit to the tax equity partner.  Let’s say they have a tax rate of 25%.  With $178.5 million depreciation they can offset $44.5 million of taxes.

In return for the $44.5 million of tax-offsets, the tax equity partner will give the developer more money for the project. 

How much?  That will depend on factors like the timing of the financing, when they get to realize the benefits, what the discount rate is, and some other aspects of the deal (usually the tax equity partner gets some cash flow stream as well – Cash from PPA in the table above).

Let’s say you get $35 million from your partner in return for the accelerated depreciation.  Add that to the $90 million ITC and you have reduced your $300 million project by $125 million – or 41%.
Not bad!
 

MAKING IT A NO-BRAINER

 
If a mildly-profitable $300 million project becomes a $175 million project, obviously that project is no longer just mildly profitable.  Some might say, it is a no-brainer.

Which is what the government wants.

Together, these two tax incentives allow solar projects to realize a lot of tax benefits right away.   Which effectively reduces the cost of the project by that amount.

What does that mean for us investors?

As long as these credits exist, the mantra will be: “build baby, build”.  Companies that are involved in these projects, either developers, financers or manufacturers, will all benefit.

The trick, and our job as investors, will be to find the one’s that will benefit the most.

That is my goal over the next few months.  Which companies stand to benefit from these big government subsidies which are now virtually written in stone for the next 10 years?

My hope is that I can find a few big winners.  Given the market we’ve had over the past year, we all could use them.
 
EDITORS NOTE

As an addendum, I would say The Little Guy did win once–in the early 2010s the premier of Ontario (14.5 M population), Dalton McGuinty, set out to transform the Ontario electric grid. (A Canadian premier=US governor).

They pushed out a build of wind and solar power projects.  To encourage those projects, they signed 20-year power purchase agreements (PPA) with guaranteed power prices.

Flash forward a few years and it was clear that the government had made a BIG mistake.  They had way-overpaid for power (2x the going-rate for wind, 3-4x for solar) to get the plants built.  And now Ontario was faced with skyrocketing electricity rates.  Many farmers had installed huge moving solar arrays in their yards and made big bank!! 

Farmers signed PPAs as high as $420/MWh! Holy cow!

Well, a few years later the Ontario government was skewered.  Deals like this saddled the province with high power prices and in large part led to the defeat of then Ontario premier Kathleen Wynne’s Liberal government (she took over from McGuinty).

In 2020 the provincial (now a Conservative premier, Doug Ford) government bit the bullet and said the government would pay for the high rates, rather than pushing those rates down on rate payers (which, given that rate payers are generally tax payers, could be taken as – po-tat-o/po-tato – but well, politics…).

Since then, governments have learned their lesson.  Not that they should not subsidize renewables.  But that they need to more discreet about it. Government is much better today at making renewable subsidies less painful.

Higher monthly power bills do NOT win votes! Far preferable are write-offs of depreciation and capital that can be transferred to 3rd parties in return for upfront cash.

That’s where the banks started to win—and win big.

HOW PROFITABLE IS SOLAR–REALLY?

0

We all know that solar is a big deal.  It is a big industry and it’s going to get bigger.   

Solar will see huge growth for the next 30+ years.  It is close to inevitable.

1

Source: Next Era Energy Investor Presentation

The percentage of the electric grid produced by wind and solar will go from 13% to well over 50% in the next 15 years.  By 2050 we could be talking 70%+.

There is big growth coming so there has to be opportunities.  Finding the next Enphase (ENPH – NASDAQ) could be a life-changing event (it went from $1 – $330 in 4 years!).

But here’s the thing. Whenever I start looking at the public solar companies my eyes glaze over.  I have to look at slides like this:

2

Source: Innergex Renewables Investor Presentation

Big-time revenue growth.  Growing EBITDA with massive margins.  Growing dividends.  But negative earnings and – much of the time – negative free cash flow.

It is a tough business to wrap your head around.  Are these companies profitable or not?


WHAT EXACTLY IS PROFITABILITY?

 
Solar is generally profitable.  Especially with some of the huge government subsidies that are available (such as the investment tax credit in the United States – a credit that offsets about 1/3 to ½ of the upfront capital expenditures of a project!!!).

But!  But, but, but.  That wedge of profitability is not as big as it looks.  It comes with a lot of assumptions.   And those assumptions make solar ripe for being distorted – to make something unprofitable look profitable.

I have invested in oil and gas producers for 20+ years.   I have watched the cycles ebb and flow.  I know (almost) every accounting trick in the oil producer book.

While generating solar is a totally different business than drilling for oil, they are surprisingly similar in a couple ways.

What I will say is this: Just about all the accounting that make oil tricky are in solar as well – AND they are even more severe.
 

4 BIG POINTS ABOUT SOLAR

 
The nature of a solar project can be dumbed down to 4 elements:

  1. Very high upfront cost
  2. Low operating costs,
  3. A long payout of consistent cash flows
  4. Tax rebates that change the picture completely

A solar project is not that much different than an oil well.   You build it (which costs a lot of money). You operate it (which costs a little money). And every year you operate it, it generates some cash.

But oil wells have three differences. Each difference makes oil well economics more transparent than solar (I can’t believe I am talking about the relative transparency of oil accounting!).

First, an oil well takes less capex; they cost less. That may seem surprising because oil is a very capital-intensive business. 

But solar requires A LOT of capital.   A 200 MW solar project may cost $300 million to build.  That same project may generate only $20 million to $25 million of revenue a year. 

Second, annual operating costs for solar are very small.  That same $300 million project may require total annual operating expenses of $7 million.   That means solar can look very profitable for a given year – 80%+ gross margins and 70% operating margins.

Third is payback.  The payback of an oil well is weighted to the front end because oil wells have a steep decline in production. 

This is helpful for an investor because you see the cash come in quickly.  It gives some assurance that its not all smoke and mirrors.

For solar, the payback is not as fast.  Solar cash flows are generally flat across the length of the asset.

A solar company signs a power purchase agreement (PPA) with a utility or 3rd party off-take.  It could be for a flat rate or market rate.  It is for the same amount of electricity every year.

The “gives and takes” on revenue are how much the sun shines, how the solar panels efficiency declines over time, and how power prices change.  These all have an impact, but not a big impact.

Finally, taxes.   Oh my stars, taxes and solar.  This is, quite honestly, a whole other article. 

The short stack is this:  Solar benefits A LOT from tax incentives.  Tax incentives can eliminate 30% to 40% of capex off the project completely.  For projects as capital intensive as solar is, that is a HUGE win. 

Tax incentives are the difference between a solar project being a loss and making a double-digit return.
 

BE CAREFUL!


The only accurate way to evaluate a solar project is to do a discounted cash flow analysis.  Figure out the rate of return (the IRR) over the life of the project.  That means coming up with a spreadsheet that looks something like this:

3
Source: My Own Blood, Sweat and Tears

This is not easy.  It is painful.  But it’s the only way.

And it is even harder for a public solar company.

Why?  Because public solar companies don’t just operate one project.

For a single solar project if you do the work and come up with a spreadsheet like the one above you can figure out what that project is worth.  You can see what the cash flows have been, what the initial debt was and make sure the debt is being paid back inline with the project life.  You can tweak numbers to understand the assumptions.   You can’t hide anything.

But because public solar companies are

A. operating multiple projects at various stages of life,
B. aren’t disclosing project level data and
C. are growing, so debt levels are naturally increasing –

…well…you must wade into muddy waters.

My takeaway for solar, as someone who has invested in oil producers, is this: be very careful before investing “for the long run”.

For a trade, considerations about long-run economics don’t matter because the market doesn’t care until it cares.  But for the long run, if the assumptions don’t align with reality, eventually that will come out.

There are lots of details that play into that.  I tried to give an overview of the main ones in my “4 Big Points”.   

I would like to delve into each of these 4 a bit more in an example in another post.  You really need an example to see how the numbers work.

But for now, I leave you with this.  As I reviewed solar projects in preparation for writing this post, I couldn’t help but be reminded of shale in 2010s.
  • Companies focused on operating cash flow and EBITDA because those numbers didn’t reflect the full-cycle costs
  • Half-cycle costs that look marvelous
  • Large capital expenditures that often exceed operating cash flow
It took 10 years for the truth high capex, high decline wells to come out.

Of course, solar is different in important ways.   The biggest being that–the government has solar’s back.  They are intent on making sure solar is profitable.

But it is hard to ignore the similarities.  Half cycle on solar projects looks great.  Companies spew large operating cash flows, and most capex is going toward growth.   It looks like a cash generation machine. 

Therefore, you see nice dividends for most established solar companies.

But BE CAREFUL.  You don’t know the profitability of any given project until you actually build the spreadsheet and work it out from start to finish.  And for most public investments, that is simply impossible.

Are the companies drawing on true free cash flow?  Or are they just pulling out equity to pay the dividends and levering up (in other words, not paying back the project debt inline with the real depreciation of the project).

Growth is a REALLY good way of making it difficult to figure out what is really going on.  That is why some of the biggest scams in the market tend to be growth-by-acquisition companies.

If you are growing fast enough, it can be very hard for the outsider to figure out whether the past investments actually paid off or not.

This is even more the case when the growth is capex-heavy growth and even more-more the case when the payout takes place over a long period of time.

Solar checks ALL those boxes.  It doesn’t mean you stay away from it – as I said it is often profitable, especially given the subsidies.  But it does mean you need to look at it with a skeptical eye.

THE MOST IMPORTANT LITHIUM TECH EVER IS ABOUT TO GET DISCOVERED BUT BY WHOM?

0

There is a huge catalyst in the lucrative lithium market right now.  It’s something that the entire global industry—and the investors behind it—are watching and waiting to happen.

Somebody, somewhere, sometime, is going to perfect DLE—Direct Lithium Extraction from underground brines.

Below, I have one of the world experts on DLE and lithium brine processing, Dr. Andy Robinson President and COO of Standard Lithium (SLI-NYSE/TSX), explain what some of the challenges have been for them to get as far as they are along this road.

Investors thought that Standard would quickly discover a DLE solution (pardon the pun), and the stock ran from 80 cents to $15 in the last two years—but after running their pilot plant for two years they are not yet commercial.

From all their research into this, they have seen the lows—two high profile short reports earlier in 2022 (because of this DLE delay)—and the highs; a US$100 million investment from the Koch brothers.  They have raised over $200 million total.

DLE is a process that will dramatically shorten the time (and hopefully the cost) to bring up trillions of litres of brine to surface, run it through a plant to parse/strip out the lithium and send the brine back down to where it came from.

Because lithium prices are so high and so profitable—up 700% to US$80,000 per tonne sometimes in the spot market now—there are dozens of lithium exploration plays listed in Canada and Australia now.

Many of these penny stocks have properties in what’s called The Golden Triangle, high up in the Andes Mountain Range on the Chile/Argentina border.

Producers up there build huge evaporation ponds, which use a lot of water, and let the sun do its magic for free for 20 months, evaporating away the water and leaving a high-grade lithium concentrate to then be processed.

But society no longer wants to wait 20 months for lithium.  It wants A LOT MORE lithium right NOW.  EV sales are booming around the world. AND… the industry is under huge government pressure in Chile and from environmentalists to do things differently.

A working DLE will almost certainly have huge and immediate impact on the lithium market.  I think there’s a good chance the Market will start to price in a large increase in supply. 

Will a working DLE become best practice across the industry (this is what happens with drilling and fracking technology in oil and gas, for example) or will it be secretly guarded by anyone who develops it?

Short answer: nobody knows.  For now, the Street is discounting DLE in junior valuations—they are not believers yet. To analysts, DLE is being treated like cold fusion—a dream.

For the long answer on the real and imagined challenges for DLE becoming a reality, I interviewed Dr. Robinson. His team has spent the most time and money amongst the juniors so far on DLE, and he was willing to share what they’ve learned to date:
 
andy newKeith: Andy, you’ve had a pilot DLE plant for two years and raised $200 million.  You have a huge body of trial and error to learn from; more than anyone else in lithium.  Can you walk us through where you’re at now in commercializing your DLE process, and what you would say are…The Big Learnings?
 
Robinson: OK that’s a big question.
 
So, we’ve been running the DLE plant for a couple of years now at the site, getting data, figuring out how to design, but almost more importantly how to operate one of these plants at an operating facility.
 
We’ve got a team of 30 people in Arkansas right now, running that plant, day and night, 24/7, 365 days a year, and we’ve been doing that since May, 2020. We’re getting the data, figuring out how to build, design, run, and operate one of these DLE plants at an operating chemical facility.
 
Keith: That pilot plant to extract lithium is on one of the big Lanxess plants, down in Arkansas. Lanxess has three big chemical plants.
 
Robinson: Right.  Now, one thing I’m pretty sure most people don’t appreciate is that–the DLE part is actually that everyone thinks is the magic beans to get lithium out of the brine, that that is the big secret, and that’s the thing to unlock everything.
 
That’s actually one of the easiest parts to solve.
 
So those loads of technologies that you can use to get greater than 90% of the lithium out of the brine, that’s actually quite straightforward, okay?  There are lithium extraction technologies everywhere.
 
The key is knitting that into a complete flow sheet. And this is where it gets, you start to just lose the average investor because as soon as you start to talk about process chemistry, people’s eyes glaze over and they don’t want to know how complicated it is, no one wants to know that.

The practical reality is complicated. 

You need to bring this giant brine stream into a plant to then have a relatively small stream of very high purity solid product coming out of the other end, which is what we are doing, right?

We’re taking this giant brine flow and we’ve got this very high, almost pharmaceutical purity product coming out of the other end, right? To do that you’ve got 6, 7, 8 separate process steps, basically. And they all have to knit together, they all have to talk to each other. The recycle loops, a flow here, a waste stream here that has to go back here, this has to be able to handle that waste stream, it all has to knit together and each process talk to one another and work on a continuous basis.

It has to happen every single second of every day. The same thing has to happen all of the time. And that’s complicated to figure that stuff out. And we’ve been able to do it because we have access to an actual operating brine processing facility, where we could figure that stuff out in real time. And that’s why we we’re so far ahead of our competitors.
 
Keith: Ah, so the DLE itself is simple, but getting the right set up for the brine to get DLE’d, that’s the hard part.  Is that right?
 
Robinson:  Kind of, sure, nothing is simple about this, but even then, you have to make sure all that happens 365 days of the year, 24 hours a day, to take a natural brine stream and do the necessary work to get it ready for the sorbent to do the lithium removal.

You have to figure out, pick and test the pieces of equipment and have the other right conditions to run a continuous plant.
 
Keith: What if anything did you have to invent, like, from scratch?
 
Robinson: Where we can use a commercially available technology, we have taken that action i.e. We have tried to invent as little as possible in our flow sheets. And we’ve tried some of that.
 
But the best success is where we’ve been able to take a commercially available solution and adapt and adopt that for use in our flow sheet. That helps a lot for where we are right now, which is looking to scale and build the first commercial plant because we can just point to it and say, “Look, we’re going to use that thing and we’re just going to use more of them basically. We don’t have to reinvent anything there.”
 
Keith: Does that mean barrier to entry is low to create your own DLE technology?
 
Robinson.  No, because it’s only in operating a plant continuously where you learn so much.

Operators come in, they turn something on, they do some chemistry and then you go, “Oh yeah, it’s working great.” Take down some data and you go, “Yeah, everything’s perfect here. It’s all working well.”

Compare that to running a plant day in day out, every hour of the day, having operators adjusting parameters at three o’clock in the morning when the plant’s still running and making a plant work under those conditions, that has been the biggest learning.
 
Look, there is industry standard equipment that you can use to do this thing. And whilst that’s true, the practical reality—and what we’ve learned is—that getting the right industry standard equipment and learning how to operate it, is really, really important because when you don’t, things foul up, they clog, you have to shut the plant down, you have to use a whole lot of reagents to clean stuff up.
 
You talk about low barrier to entry, but in the lithium developer world, I think the market has been a little credulous about how easy it is to go from running a pilot plan in a SEA-CAN somewhere separate from the project for a few weeks or a month.
 
Going from that to actually running and operating a real continuous process is quite complicated, has a lot of practical learnings that you just have to learn. So that’s really been the biggest understanding for us.
 
Keith: OK, tell us where you’re at in your DLE process.  When will you guys be producing home-grown lithium in the USA?
 
Robinson:  The first commercial project is going to be built on one of the Lanxess facilities in Arkansas, near the town of El Dorado. So, it’s the same facility where we’ve got the demo plant running right now. We don’t have to drill a well or build a pipeline; everything is already there on their site.

We’ve done some pre-feasibility work with an engineering construction company. We then went to a competitive tender process to find the best partner to basically do the engineering design, the bankable feasibility study, and with the conversion mechanism defined in the contracts to become the EPC contractor. And, we went through that competitive process in the late spring, early summer.

By the middle of next year we see ourselves moving towards construction;  basically second half of 2023.
We think we’re probably the only project in North America that can point to that really quite short period between where we are right now, finishing up all the design studies, the engineering, et cetera, all of that to moving towards construction by the end of 2023.

And the only way we can say that Keith, is we have no permit issues on our critical path, right? We don’t have any federal permits. So we are not on public land, like in the desert in western US. We’re not in California.
 
Keith: You have all your permits to go into production?
 
Robinson: We have some minor permits that we’ll need to get from the state, but no federal permits.  There’s a minor air emission permit we’ll need to get; it’s about a three month permit process. We’ve got a surface water discharge permit. Again, that’s just a short permitting window. So, we don’t foresee anything that we have to get to allow construction to commence, which is on the critical path.
 
Keith: How much lithium are you going to produce?
 
Robinson: Remember, this is the first one, so it’s not a huge project.  It’s going to be a little under 6,000 tons per annum of battery quality lithium carbonate for the first commercial project. So it’s not a globally significant project in terms of its scale.

However, it allows us to be fiscally responsible moving into the first project, given that there’s risk. It’s the first one of its kind, and like you say The Street is still not convinced about DLE, but it will be the first one commercially constructed that we can point to, and we’ll get revenue out of it.
 
Keith: You say this is the first one.  How many DLE plants are you going to do? How many can you do?
 
Robinson: Well, let me put it this way: We’re in the what’s called The Smackover Formation.  It is a very large subsurface brine resource, touching central Texas all the way to Florida. This is the best brine resource in North America.
 
There is nothing like it anywhere else on the planet based on every piece of research that we’ve looked at. The Smackover Formation is globally significant as a lithium resource for the whole EV transition story.
 
Because the resource is so consistent (and we’re starting at the Lanxess plant at 220 to 240 PPM lithium in the brine, which is good), the brine is the same, the depths of the brine is the same, how we get it out the ground is the same, how we put it back in the ground is the same, and the plant that we need to build to process it is the same.

So, the first commercial Lanxess facility will be proof that our DLE works, and then we can replicate and scale across our asset resource base in the Smackover fairway.

You know we have our South West project, which is a greenfield area of leases in Southwest Arkansas where that’s going to be a 30,000 ton per annum lithium hydroxide project.

I think we’ve got a very compelling story with all that. I think we’ve got great partners to help us do that.
 
Keith: But you don’t have the entire Smackover staked.
 
Robinson:  No, for sure, but it’s difficult to build up a big land position. You have got to spend a lot of money and it takes a lot of time to do it. And at the same time there’s no point having a big land position unless you’ve got the technology that you know is going to create the value from that land position.

And we’ve been lucky again that we are the only group that’s been able to deal with a real brine coming continuously to the ground, to the surface day in day out and to be able to figure out a process that works with that actual brine, and we can then translate that across the region.

That’s not to say that there won’t be others, I’m sure there will Keith, but I think we feel we’re ahead of the pack. We’ve got a good competitive advantage, we have great partners, we have large partners who want to see this succeed.
 
Keith: Big partners like Lanxess and Koch Industries.
 
Robinson: Yes.  Koch has put money into a whole bunch of other EV and battery metals related businesses as well. So, they’ve bet very heavily on this particular energy transition story. So yeah, they’re being very, very helpful, very helpful.
 
So, you need big partners who help push you along because otherwise it’s just hubris, right? You’ve got small developers saying oh yeah, we’re going to do this, that and the other. And it’s not real. They’re just telling fantasy stories about what you’d love to do, but you need big partners who will help you move along, give you the support, give you options, have ancillary businesses that you can lean on, et cetera. That’s actually how you get stuff built.
 
Keith: Last question Andy—are you—like Standard Lithium—ever going to announce that your DLE technology is commercial or are you going to keep it quiet?
 
Robinson: Yeah, and I think we’re contemplating doing an investor day, Keith.
 
Keith: To say what?
 
Robinson:  You’ll find out the same as everyone else Keith.
Keith:  Ok.  Anything else you want to share?
 
Robinson:  I know that we’ve been very quiet lately Keith. We’ve been very focused on execution to address the short naysayers who I think they’ve knocked the wind out our sails in terms of engaging with the street and the market.

That was a very unpleasant experience. Completely unfounded, just crazy. But those things happen. I think we’ve, as a result we’ve been very conservative about communicating, telling the story, we tended to keep our powder dry a little bit.

I think we are now at the point moving into execution, real execution that we know we can expect to engage a bit more with market and with shareholders on a public communication level.
 
Keith: OK.  Andy, thank you for your time.  Very informative and look forward to more communication.
 
Robinson:  Thanks for your interest Keith.
 
DLE—Direct Lithium Extraction—will be one of the biggest developments in helping the global EV industry catch up to surging demand.  It will shorten the time frame and likely lower the cost of lithium production.  It’s a big deal—for the sector and its investors.

IS OILFIELD SERVICES (OFS)  THE WAY TO PLAY ENERGY RIGHT NOW?

0

Halliburton (HAL – NYSE) released their third quarter results on Tuesday night and boy were they ever bullish on oil field services (OFS).

Right out of the gate CEO Jeff Miller put it bluntly – “our outlook is strong”.  He followed it up by saying why: “oil and gas supply [will] remain tight for the foreseeable future”.

These comments echoed what we heard from Baker Hughes (BKR – NYSE) when they reported last week.

While Baker Hughes admitted that the macro-outlook was “increasingly uncertain” they said they were looking forward to a “multiyear upswing” in upstream oil and gas spending.

The irony is that what is driving the outlook is the lackluster response of operators.  There is no drilling boom.  Quite the opposite.

It is financial discipline that is setting the stage for a much longer – and potentially more profitable – upcycle.

Baker Hughes expects prices to remain strong even if there is a recession because we just aren’t seeing the usual “drill-baby-drill” response we have seen in the past.  Halliburton pointed to “multiple years of underinvestment” supporting their long-term thesis.

While North America is strong, it is international operations that are accelerating.   South America, West Africa and the Middle East are leading the way.
 
That’s probably why Schlumberger (SLB-NYSE) is up 50% in a month, and hitting 4 year highs.  This OFS major is very well distributed around the globe.

In the US, The S&P Oil & Gas Equipment & Services Select Industry Index (XES-NYSE) has also had a run recently, within 8% of its year high (which is also its 3 yr high).

In Canada, analysts are talking about a 30% increase in OFS fees to producers this year, with another 10% next year.

So it looks like an increase in revenue and EBITDA for the rest of this year and next year is in the bag—much of it at the expense of oil and gas producers, their customers.

Like the producers, OFS companies have gone crazy trying to grow, with new capex for yellow iron remaining low.  The most I see in costs is actually a “greening” of OFS equipment—moving away from diesel to natgas fueled rigs and machinery.

PRODUCER CASH FLOW COULD FLATLINE OR DROP
EVEN IF OIL GOES HIGHER

 
If you have been reading my blog for even a couple years (I started blogging in 2009) you will remember one of my sayings—there is no such thing as an American oil stock.  They are almost all natgas producers with a 40% + wighting in oil.  The Permian starts off oily, but gets gassy quickly.  Only the Bakken up in North Dakota—where the geology is shallower—do you see true oil stocks.

That means producers’ cash flows are heavily weighted towards natgas—which is looking weak right now, and will likely get weaker.

Natural gas pricing has dropped from levels that quite honestly, I never thought we’d see.  Some say a correction was due.  I say the industry is catching up.  It always catches up.

So there’s a good chance that even if oil prices rise a bit–highly likely–overall cash flows for NA producers might not benefit from higher cash flows if natgas falls even more.

And that’s VERY possible.  The big headline this week was that spot EU natural gas prices went negative.  Less of a headline was that Permian natural gas prices (the big Texas oil play that produces many billions of cubic feet of associated natural gas) also went negative.

Of course, that has everything to do with pipeline constraints.  But it does demonstrate that producers of natural gas are doing what they do best – producing more of it.

In the Marcellus (northeast USA)  and Haynesville (Oklahoma/Louisiana) rigs are up 50%.  In the Permian, it’s up 30%.  We are seeing higher output as a result – up 4.5 bcf/d year-over-year.

1

Source: Bank of America Global Research

Production of natural gas is sneaking up.  I’ve been telling subscribers for weeks that prices will be coming down as the US is increasing natgas production steadily in 2022—often by 500 million – 700 million cubic feet of natgas per day per month. Inventories of natural gas are sneaking back up towards the 5-year average. 

Prices are going the other way.

2

Source: Bank of America Global Research

Natural gas prices are still above $5 which means there is still incentive to drill.  But it won’t take much (a warm winter anyone?) to send them down further. 

At some point that could mean a much lower natgas rig count in the US—now at 157.  My research suggests it only taks 110 rigs to keep US production flat, so that’s 47 rigs that could drop over time.  But while the front month natgas price is down a lot, the pricing two years out on the futures curve has not moved near as much.

That’s not a huge predictor of price, but I think that’s what producers will be looking at before seriously putting down rigs. (That will take pricing even lower of course!)

WHAT IF OIL JUST GETS BORING?

 
While natural gas has a few headwinds, oil looks better.  Trying to figure out what oil prices should be (meaning absent intervention) is impossible.  What with

  1. the OPEC+ cuts,
  2. SPR releases in the USA
  3. Chinese lockdowns,
  4. and the huge shortages of refined products (especially diesel) in the western world

that are pushing up prices further up the chain – it makes my head hurt.

The simplest answer – the one no one ever says – is maybe oil prices just don’t do much of anything at all?

We’re always looking for a big run up or a huge collapse.  It would confound everyone if oil just sat this one out, in a relatively tight range, and bored all the traders to sleep.

If it does that, the OFS providers will take it as a win.  Those with international exposure (to Brent and Middle East pricing), will do well.

The operators with the biggest exposure are the big guys.  Baker Hughes, Halliburton, Schlumberger (SLB – NYSE).

Going big is usually out of my wheelhouse.  But international small cap OFS is a tough find these days.

The problem with the big boys is that they aren’t exactly cheap.

3

Source: Sentieo Data

There may be upside to these estimates, but paying some 20x earnings and 10x EBITDA for OFS doesn’t strike me as a bargain.
 

GO TO SEA

 
One comment that caught me off guard came from Baker Hughes.   They made special note of the growth in offshore activity – saying it is “noticeably strengthening”.

Baker Hughes forecasts “several years of growth” in their international and offshore business.  Quite the statements given that offshore has been left for dead by many.

Those comments led me to do a shallow dive into Transocean (RIG – NASDAQ).
I fully admit I had written off companies like Transocean just like everyone else.

Yet Transocean did $245 million of EBITDA last quarter   On their last call, which was Q2 back in August, Transocean said they saw a “rapid tightening of the offshore market for high capability drilling assets unfolding across multiple regions”.

Yet the stock is barely back to where it was at the end of August and still well off of levels from March to May.

4

Source: Stockwatch.com

Of course, everyone watching Transocean is worried about the debt.  For good reason.  One year default swaps on Transocean imply about a 1 in 5 chance they default.

Transocean has a lot of debt–$7.2 billion of it.  While they have $2.5 billion of liquidity today, they expect that liquidity to decline to $1.1 billion by December 2023.

Lots to worry about.  But its hard to ignore what they are saying about the business.  A “very constructive outlook”, expecting “further tightening”, and “increasingly healthy day rates” – again this was back in August.  Now Baker Hughes is telling us that the outlook has only gotten better.
 

WHAT COULD HAVE BEEN

 
What I would really like is a straightforward bet on international OFS activity.  Fortunately, I know just the name!  Unfortunately, there is a catch.

I owned National Energy Services Reunited (NESR – NASDAQ) as a portfolio company from mid-2020 until the summer of 2021.

This is not a household name, but also not a micro-cap.  You may never had heard of NESR.  But it is one of the largest OFS companies in the Middle East and Asia Pacific region.

NESR is the only publicly traded oilfield service pure play in the region.

You could argue a focus on the Middle East, what with OPEC+ cuts to production, does not play in their favor. 

But NESR might make up for it on volume.  In September they announced that they had secured their first multiyear directional drilling contract with Saudi Aramco.  This after they were awarded a $300 million fracturing contract from Aramco in April.

NESR seems in many ways like the ideal play.  

The problem, for the moment, is that they have no financials.

In February NESR announced they would have to restate their 2021 financials due to issues with accounts payable and accrued liability accounting.

They’ve quantified the restatement (at most $90 million) and at the time of the restatement announcement they guided to decent YE results.  But still, its tough to make a call here until the restatement is out of the way.

I’ve always liked the NESR business, and as I said I owned them in the portfolio last year, but I never jump into a stock where I can’t see the numbers.

I am on the lookout for news that the accounting issues are behind them.
 
In North America, there are 6-10 drillers and frackers in both Canada and the US.  Like the producers, they were priced for bankruptcy and then had GREAT stock runs in 2021. 

Energy is slowly getting more respect from generalist funds due to low valuation and return of capital (Share buybacks and dividends). Now energy charts suggest they could run again–but multi-baggers are gone, just like with the producers now. 

I’m happy with 50% in a year.  But unless the multiples get up off the mat–most are trading 2-3.5x cash flow–they will need their multiple to almost double as well.  With lower natgas potentially keeping producer cash flows in check, I think we’re at that part of the energy cycle where if it happens anywhere, it can happen in OFS stocks.

TAKE-OUT VALUATIONS SAY: THE BIG MONEY IN ENERGY–IS IN THE RENEWABLE SECTOR

0

I have a hard time saying this sometimes—but The Big Money in energy is still in renewables.  I mean, oil especially but also gas stocks are (across the board) cash cows right now—like never before in modern energy history—and they’re so CHEAP—like, 2-4x cash flow.  That’s half to one-third the multiple of the last cycle ending in 2014.
 
We should all be buying them hand over fist, right?  But we’re not, or those cash flow multiples would be higher.
 
I have to say–whether it’s lithium or hydrogen vs oil & gas, or energy storage vs transmission lines and pipelines, the Market is screaming at me to focus more on renewables.  Renewables are—yes a bit more risky—but much more highly valued.
 

The poster child for this was this week when energy major BP (British Petroleum; BP-NYSE) paid US$4.1 billion, or 25x EBITDA, for RNG–Renewable Natural Gas–producer Archaea Energy (LFG-NYSE), which also equates to a more than double since it got listed less then two years ago.  They mostly produce gas from landfills.  Archaea got a big premium (think that Continental minority shareholders got almost no premium).

RNG is very costly to produce—the numbers I see suggest a ballpark price of US$15/mcf, but can be as low as US$10/mcf.  Selling prices are (or were, up until natgas recently coming back to $6/mcf in a hurry) roughly $23-$30/mcf—so big profit margins for the producer. 

(But that also makes it tougher to sell to utilities, who obviously want the cheapest natgas they can find—except if it helps their ESG score with the institutional investment community)

LFG operates 50 RNG and landfill sites across the US, producing about 6000 boe/d of volume, with a development pipeline that the company thinks can increase RNG production by 500% by 2030. They’re talking EBITDA growth towards $500 million by 2025 and $1 billion by 2027 from the asset base.  That’s BIG growth, and of course it’s ESG-friendly. 

Nobody is paying 25x EBITDA in oil and gas. To wit:
 
Bank of Montreal rightly pointed out in one of their morning energy notes recently that (everything in brackets I’ve added):
 
“from a North American upstream E&P perspective, notwithstanding the macro & commodity price volatility over the last 4 months, we have seen

  1. the definitive take-private of Continental (Resources, CLR-NYSE, for a single digit premium),
  2. Diamondback’s (FANG-NYSE) US$1.6 bn acquisition last week of (privately held) FireBird Energy, (3x EBITDA, and the Hart Energy story said that wasn’t cheap as some deals recently)
  3. Warren Buffett increase his Occidental (OXY-NYSE) stake to nearly US$13 bn or ~21% of the company (not including his US$10 bn preferred shares & US$5 bn of warrants),
  4. EQT’s US$5.2 bn acquisition of Tug Hill, (2.7x EBITDA and 27% FCF—Free CashFlow—yield—that’s CRAZY CHEAP)
  5. multiple billion dollar bolt-on acquisitions from Devon, (they bought Validas in August—35K boe/d at 70% oil for 2.0x EBITDA)
  6. while in western Canada we saw private-co Hammerhead’s ~$1.4 bn SPAC transaction last week
  7. Tamarack’s (TVE-TSX)recent acquisition of Deltastream for ~$1.4 bn, (with $500 M EBITDA this is 2.8x EBITDA)
  8. private-co Strathcona’s ~$2.3 bn cash acquisition of Serifina,
  9. Whitecap’s (WCP-TSX) ~$1.7 bn cash acquisition of XTO Canada (3.3x cash flow with 20% FCF yield)
  10. Cenovus’ (CVE-NYSE/TSX) ~$1.0 bn cash acquisition for 50% of the Sunrise oil sands project; (BMO said just under 2x cash flow)”

Add to that—renewable stocks have been destroyed in the last year.  Oil stocks are holding in really well after rising 5-10x in 2021; but most of them are now flat since March.  Oil prices are doing OK—but natgas prices are coming to earth as I write, down to $6.50/mcf in the US from $10 earlier this year.  And as I have pointed out a couple times on Twitter recently, Canadian natgas prices have been ZERO several times this year already, and small hubs are even NEGATIVE some days.
 
So if you have a bit of risk tolerance, I see The Big Wins in energy in the renewable space right now.  They get way higher multiples—every additional Gigajoule or barrel of oil equivalent of energy they add gets rewarded A LOT MORE by the Street.
 
And after looking around for months, I think I have found one.  I’m almost done my research—I’ve talked to management several times.  They have  millions in the bank. They have powerful friends in high places.  I’m going to be telling you about them very soon.  Stay tuned.

TODAY’S VOLATILE TRADING WAS ALL ABOUT POSITIONING

0

The Consumer Price Index (CPI) came out this morning (Thursday October 13,2022) and it was HOT, HOT, HOT.  In response, markets did exactly what you would have expected: they full-on collapsed – well, for about 90 minutes anyway.

The CPI print came in at 8.2%.  Consensus had expected 8.1%.   The higher number just meant more of the same – more Central Bank tightening for longer and more chance of recession.

The S&P tumbled all the way down to 3,500.  It even tapped out below 3,500 briefly in pre-market.  It looked like we were in for another rout.

Nope.

Instead, we got a half hour of EXTREME weakness and then strength and more strength.  The S&P is now UP 100 points on the day.

What the heck just happened?

Don’t ever forget that the stock market is just a bunch of buyers and sellers.  It is not forecasting the shape of the economy on any given day.  When the buyers outweigh the sellers, the market can go up, regardless of the news.

I believe this rally was foretold in the positioning.

Goldman Sachs published data heading into the CPI number that showed just how much fear there was in the market.

1

Source: Goldman Sachs

The chart is telling us two things: Gross leverage among hedge funds has been going up and net leverage has been going down.

What does this mean?  It means funds are getting more leveraged but also less long of stocks.

You can see that gross positioning is going up.  That is telling you leverage is going up.  

It is back to where it has peaked out a few times this year.  It is close to the February 2021 highs.

But net exposure is going down.  This is NOT AT ALL like February 2021.  At that time net positioning was high.  Meaning funds were very long.   Now it’s the opposite.

Funds are leveraged up and short, or at least a lot more short then they have been in a very long time.

In other words, funds are bearish (not without good reason).  But they haven’t been expressing that bearishness by selling out of their long positions.  They’ve been adding to their shorts.

Doing this makes it much more likely that if the market goes the wrong way they will need to respond.  

If a hedge fund is just bearish and is therefore decreasing their gross exposure (ie reducing their longs) they wouldn’t panic when the market goes against them.  But if they are levered up with both long and shorts, they have to start selling to make sure things don’t get out of hand.

That is what is happening today.  It’s a short squeeze.

How long will it continue?  The million dollar question and if anyone says they know, don’t believe them.  

What I will say is that this scenario has come up twice before this year.  Once in April, once in June.  Those two other peaks you see on the gross exposure line.

Both led to rallies that lasted 5-10 days. The June rally petered out but got a second wind in mid-July when markets began to take the pivot to heart.

This time around?  Well, the headwinds are bigger now.  

It is getting harder to ignore the bad economic data. It is getting harder to defy all the hawkish FedTalk.  It is hard to imagine a pivot.

But you can try to find positives and a rally will make everyone look hard for some reason to pin it on.

It may be in the minority, but some are seeing positives in today’s inflation numbers.

2

Source: Twitter

This is not without merit.  The reality is that inflation IS coming down. You can see it in nearly all the commodities, in inventory data, in the shipping indexes, and in leading indicators of rents. 

3

Source: Twitter

At 930am EST it was very easy to spin today’s data into a big doomsday narrative that takes the market down 3%.   That is exactly what we had everyone talking about – until 10am.

But it not all that hard spin it the other way, at least for a few days.

I wrote a month ago that “when inflation starts to fall the market is going to start looking at what the world post-inflation looks like.”

4

Source: Bloomberg

Inflation is not quite falling yet.  But its not rising all that much.  And there are bunch of forward-looking measures that usually precede dis-inflation and they ARE falling.

Does all this make me bullish?  Well, no, not exactly.  Because the reason inflation is topping out is because the economy is not doing very well at all.  Which is not good for stocks.

In the long run that is.  But for a few days?  Sure. 

With the kind of offside positioning that we have right now, inflation topping out is good enough for a short run-up.