Lithium Prices To Stay High To 2024–UBS

0

LITHIUM PRICES TO STAY HIGH THRU 2024–UBS

85 page report suggests industry will remain highly profitable

Lithium prices will remain well above historical levels thru 2024, UBS Securities said on Thursday June 15, as electric car batteries reach cost parity with ICE—Internal Combustion Engines—in mid 2018.  They suggest that will spark a huge increase in demand; one that the lithium supply chain will be hard pressed to meet.

Lithium and cobalt are two obscure metals that are key ingredients in batteries that will be used for Electric Vehicles, and both residential and utility power storage for renewable energy sourced from wind and solar.

Lithium is like the “frac sand” of the new, greener, energy era.

UBS’ June 15 report—entitled Driving Disruption—is also positive news for investors in developing lithium brine plays, suggesting gross profit margins will be over US$5000/ton for years.
A

UBS says falling battery costs and simultaneous improvements in battery capacity and performance will drive Electric Vehicle (EV) sales.  Costs will drop even more as technology improves and the scale of the industry increases. Government incentives in Europe and China are big tailwinds, UBS added.

The only bump in the road for lithium that they see is that current prices—a record US$12 per kilogram (or US$12,000 per ton)—is likely to drop to $9 after 2018.

A

Lithium is sourced through either hard rock deposits, which are mostly in Australia, and through liquid brines, which are mostly on the Chile/Argentina border at 3000 metres (9,800 feet).

The chart below shows the cost profiles of both brines (in blue) and hard rock deposits around the world.  Brines are clearly the most profitable—and from UBS’ predictions, will stay that way:

A

If prices are $9000 per ton, and costs are only $3000/t—that’s some very good profit!

The increase in lithium production required to meet this demand is staggering, compared to the current global market for lithium.  The chart above shows what happened to lithium pricing as it’s used in the batteries of consumer electronics.  Future pricing estimates are adding two new global markets—EVs and large scale battery storage.

UBS outlined just how much extra lithium has to get into commercial production to meet demand:

 A

Lithium must see a 2898% increase in production, while cobalt must see a 1928% increase.

UBS suggests supply routes are full of uncertainties saying that both the liquid brines and hard rock deposits “show a chequered history of successfully running operations both consistently and near nameplate capacity”.

 A

This chart shows that no brines hit full capacity, and neither do the hard rock mines.  On June 14, Aussie hard rock producer Galaxy Resources (ASX: GXY)—one of only two new junior lithium producers in the world—said their recoveries did not meet expectations.

Of course, all these supply problems are bullish for future lithium prices.   Which brings me to the question I always ask…how do I make money off all this information?

To me, the leverage in this fast growing sector is with the development companies; the near-term production players who are getting ready to meet the rising demand for lithium.  The Big Producers like FMC and Albemarle (ALB-NYSE) have already seen their stocks double and triple respectively in the last 18 months.

One company that has the assets and the funding to make it happen is Advantage Lithium (AAL-TSXv).  Chairman David Sidoo has just raised $20 million to buy 75% of the Cauchari brine deposit, the flagship exploration project of Orocobre (ORL-TSX/ORE-ASX).

The asset is considered so good, many lithium watchers were surprised to see Orocobre part with it—but they still own about 50% given they vended it to Advantage for shares, and also now sit on the board of Advantage.

Analyst David Talbot of Eight Capital in Canada has a price target of $1.90 on the stock, which would be a 400% gain on AAL’s share price today.  There are two key points that make the most sense to me:

Low risk development.  Cauchari’s proximity to both Olaroz & Cauchari-Olaroz reserves suggests low geological risk.  It has good grades, chemistry, porosity and permeability.  Upside potential stems from the belief that the salar may extend three times deeper than the limit of its current 470,000 t LCE resource.

Quick resource growth.  Plans to expand Cauchari resources four- or five- fold to between 2.0-2.5 MMt LCE via deep drilling”  (LCE=Lithium Carbonate Equivalent)

For investors, the upside is near at hand as the drills are now turning up at Cauchari.   AAL’s Cauchari is not only just 16 km (10 miles) from Orocobre’s Olaroz mine, it is one half of a large brine deposit (called a salar) that already has many holes of high grade brine—that were drilled right along the Cauchari’s property boundary.

So the chances of success are high, and near term.  If the drilling is successful, Chairman Sidoo has high hopes of getting the asset into production very quickly, via a pipeline to the existing Olaroz mine.

“By building a pipeline which would only be 8-10KMS’s from our partners processing facility at Olaroz. Orocobre would charge us a nominal processing fee and we would be selling lithium directly into the market immediately.”

Sidoo says they have several Confidentiality Agreements signed with major producers now.  “People like these big batteries are inquiring all the time right now about companies that have either production, or near term production. We want to get into the market immediately.

“Our long-term strategy going forward could be partnering with a large lithium producer or battery maker. This partner would fund a large processing facility, which would lower the cost to build one on our own.”

All the data from UBS—and current market prices–certainly says if you have real lithium for sale, it’s a sellers market.  As these near term producers meet their development milestones, they could get interest sooner rather than later from larger companies who want some of the big profits the industry is now generating.


Is Kinder Morgan Canada Now a Sucker’s Bet?

0

Kinder Morgan Canada – Is This Now A Sucker’s Bet?

If the Trans Mountain pipeline expansion from Alberta down through B.C to Vancouver goes ahead as planned, then Kinder Morgan Canada (KML-TSX) will probably be a decent investment at current prices.  I run through some math with “one-foot-planted-firmly-in-the-air” below and come up with a potential 50% return from here–in just over three years.

That is actually better than what the Market expects from capital intensive, yield paying, energy infrastructure plays.

On the other hand, if the Trans Mountain pipeline expansion does not proceed or is significantly delayed–which is now likely the case without a pro-business government in Canada’s most western province–then Kinder Morgan Canada is not going to do well by investors.

In fact it could do very poorly.

With an unfriendly government soon to be in power, the range of outcomes is now where the best case scenario is average/mediocre and the worst case could be awful.

This is the kind of asymmetric bet that only a fool could love.

For Canada’s Oil Industry – This Pipeline Is Vitally Important

Economically, the Trans Mountain expansion looks like a windfall for Canadians.

An economic stimulus package and enormous source of tax revenue all rolled into one.  It would be good for the economy and good for the taxpayer.

Here is what the pipeline is going to generate for Canada, British Columbia and Alberta during the construction phase and over the first 20 years of operations:

  • $21.6 billion in federal taxes
  • $19.4 billion in provincial taxes paid to Alberta
  • $5.7 billion in in provincial taxes paid to British Columbia
  • 15,000 equivalent jobs per year during construction
  • 37,000 equivalent jobs per year during first 20 year of operation
  • 800,000 person years of employment
  • $922 million of property taxes in British Columbia
  • $124 million of property taxes in Alberta
  • $3.7 billion of annual incremental revenue as a result of selling oil internationally instead of to the United States

For the oil industry the pipeline isn’t just a good thing, it is absolutely crucial.

This is a desperately needed solution to get adequate pipeline capacity in place to meet rising production.  Without it Alberta oil producers have major problems.

a

Source: Kinder Morgan

After years of angst, last November the Trans Mountain expansion finally received approval from Liberal Prime Minister Justin Trudeau. The current British Columbia (provincial) Liberal government has also pledged support.

But recently, things have gotten a lot more complicated.

Three weeks after the May 9 provincial election, on May 29, 2017, the B.C. Green Party agreed to support the NDP (The New Democratic Party; the national left wing party in Canada) in the legislature.  Doing so gives the NDP the support of a total of 44 members (their 41 members plus 3 Green members).

That is one more than the ruling Liberals which have 43 seats, and effectively ends their government–at some near term point.

The BC Green/NDP agreement was really bad timing for the stock of Kinder Morgan Canada–their $17/share IPO was on the same day, May 29.  The stock never traded that high; investors have lost money since Day 1.

That Liberals now have two basic options.  Either resign (hand over power) or requesting to dissolve the legislature and hold another election.

The relevance to the Trans Mountain pipeline is that part of the agreement between the NDP/Green coalition is that they have said that they will use “every tool available” to kill the Trans Mountain expansion.

While Trudeau and the Federal Government do officially have the power to push the pipeline through, consensus is that the Prime Minister would do serious damage to his political brand by doing so.

Is backing this pipeline worth that career damage for him?

Since the NDP/Green announcement, Trudeau has reaffirmed his support for the Trans Mountain by saying that the facts were his basis for approving the pipeline haven’t changed.

Whether he is willing to actually fight for it (which he will undoubtedly have to do) remains to be seen.

That leaves Kinder Morgan Canada and its shareholders in a complicated situation.

Scenario One – Pipeline Gets Built

The total cost of the Trans Mountain expansion is estimated to be $7.4 billion.  $1.2 billion has already been spent and there is another $6.2 billion to go.

Kinder Morgan’s plan is to spend that $6.2 billion mainly in 2018 and 2019; very quickly.

The funding of all that cash is expected to come through a combination of an existing credit facility, term debt and the issuance of preferred equity.

The addition of a $7.4 billion pipeline is a huge step change in operational capacity and earnings power.  This isn’t a “tack-on” asset for the company, the Trans Mountain expansion is basically going to become the company.

The chart below shows what the assets of Kinder Morgan Canada are generating now for EBITDA and what they will generate with the Trans Mountain expansion.

 a

You can see that Kinder Morgan Canada goes from $395 million in EBITDA with its current cash generating assets to $1.3 billion with the Trans Mountain expansion up and running.

As I said, the Trans Mountain expansion will become this company.

Kinder Morgan currently trades at 14 times 2016’s EBITDA–which is hardly a bargain.  On projected 2020 EBITDA levels however the valuation looks better even with all of the additional debt and preferred equity that will be required factored in.

If the pipeline (miraculously) goes forward as planned without any real delays, shareholders should make out great from current share prices.

I did some very back-of-the-napkin math on the 100% ownership of the assets in KML. If EBITDA (fancy acronym that basically means cash flow) is projected to be $1.3214 billion, and it trades at 12x EBITDA, that’s an Enterprise Value of $15.8568 billion.  (TransCanada now trading at 11.9x and Enbridge at 11.5x and Pembina Pipeline at 12.1x)

Subtract $5.7 billion net debt for a market cap of $10.1568 billion.  Divide that by 395 million shares (remember that parent KMI-NYSE still owns a majority interest; KML is a minority holding of the assets) and I get and debt of $5.7 billion, I came up with a rough estimate of $25.71 per share by the end of 2020–if everything goes perfect.

That’s a gain of 55% in three years from a big infrastructure play–that’s not bad.  But that’s if everything goes perfect, and now that the pro-business BC Liberals did not win a majority, we know there won’t be much perfect about this Trans Mountain expansion.

Nobody would go into a company like this expecting to knock the lights out.  Investing in the capital intensive pipeline business is generally not one that is expected to produce large growth stock like returns.

Scenario Two – The Project Doesn’t Get Off The Starting Line

The best case scenario is a decent, but not spectacular investment return.

What do Kinder Morgan Canada investors get if the NDP/Green group are successful in shutting the project down?

The answer to that really depends on how much cash Kinder Morgan burns through on the Trans Mountain before it becomes clear that it won’t be completed.

$1.2 billion of the $7.4 billion cost of the pipeline has already been spent.  There is another $6.2 billion to go.

If Kinder Morgan were to sink another couple of billion dollars into the project and then have an unexpected court ruling put a halt to it…..well that would be a disaster.

If that happened the company would have billions of dollars invested in assets that aren’t going to ever generate a nickel of revenue.  Worse still, that cash was all debt financed so the company will need cash flows to offset that leverage.

Remember such a scenario is not unprecedented.  It is a very possible outcome.

TransCanada Corp (TRP:TSX/NYSE) took a $2.9 billion write-down of the Keystone XL in the fourth quarter of 2015 when President Obama blocked the pipeline.  That was very real money that would have been effectively flushed down the toilet without the surprise Trump victory.

TransCanada is a very large company and that write-off hurt.  For the much smaller Kinder Morgan Canada, a similar write-off would hurt a lot more.

While I wouldn’t pretend to know what the end result of the Trans Mountain expansion will be, I do know that there is a very real chance that it doesn’t get completed.

Not being cancelled entirely is not the only risk.  The project could also many delays (perhaps lengthy ones) which could push the ultimate cost of building far in excess of expectations.  And it will only take one lengthy delay for the Market to permanently penalize the valuation of KML-TSX due to perceived increased risk in getting Trans Mountain complete.

I am fairly (sad and) certain that it will face fierce opposition until the bitter end.

This Is The Exact Opposite Of What You Should Want As An Investor

As an investor I’ve learned to love asymmetric opportunities.

I’m talking about cases where there is very little downside and a whole bunch of upside if things work out as expected.

Kinder Morgan Canada now looks like the exact opposite of this to me.

If project development with Trans Mountain goes off without a hitch, then investors at current prices will generate an acceptable return.  If complications arise, the project gets delayed or even cancelled investors are going to poorly…..or worse.

Frac Sand Stocks Are Going to…ZERO? says Dan Loeb

0

Dan Loeb’s Bearish View on Frac Sand Stocks

Earlier this week, I showed you how the share prices of frac sand suppliers have crashed since February and have generated a lot of pain for shareholders.

Here is the not so pretty picture:

Ticker Company 2017 Share Price Peak Current Share Price Decline % Decline
SLCA U.S. Silica $61.49 $37.39 $24.10 39%
EMES Emerge Energy $24.45 $11.19 $13.26 54%
HCLP Hi-Crush $23.30 $13.37 $9.93 43%
FMSA Fairmount Santrol $13.12 $5.00 $8.12 62%

Shareholders are feeling the pain but not everyone is unhappy.

Especially not hedge fund manager Dan Loeb who had placed a timely bet on the share prices of these companies collapsing.

What’s more, Loeb doesn’t seem to think the pain is anywhere close to being over.

a
 
Loeb – Really Good Track Record, Really Doesn’t Like Frac Sand Miners

I tell my wife all of the time.  Making money is easy, keeping that money is hard.

I’ve worked in and around the equity markets for a long time.  I’ve lost count of how many people I’ve seen make and lose fortunes.

Therefore I’ve learned to respect the opinion of investors who have proven that they can outperform over the long term.

To do that a person must be good at spotting opportunities but even better at avoiding trouble.

Dan Loeb’s long term track record makes his opinion worthy of considering.  Beating the S&P 500 is hard to do; the vast majority of fund managers can’t do it.

Loeb has doubled the S&P 500 since his fund launched in 1996.

His performance is actually a couple of percentage points higher than that because the 15.8 percent return is after his management and performance fees are deducted.
a

If you own frac sand miners you aren’t going to enjoy what he has to say.  That doesn’t mean that you shouldn’t consider it.

Here are his exact words extracted from his first quarter letter to investors:

Is sand the new gold? 

In early Q1, the combined market capitalization of frac sand miners had reached $11 billion, pricing in an average Enterprise Value per ton of over $300 or over 15x replacement value. 

An army of consultants, sell-side analysts, and speculators were confidently pointing to the exponential rise in demand for frac sand as rig counts and company budgets turned a corner, drilling activity was on the upswing, and proppant intensity was rising.

The frac sand industry’s cheerleaders were certain they could continue to outwit the laws of supply and demand.
Our field work identified an important shift from the use of northern white to abundant in basin brown sand.  In addition to a large and growing number of greenfield projects that are creating new capacity, we uncovered significant overhang that has been sitting on the sidelines and is now being reactivated.

As sand pricing starts to decline in summer or fall at the latest as a consequence of the outsized supply we have seen, we expect many of the publicly-listed frac sand miners to end up with little if any equity value.

He doesn’t like much about these companies.

He finds valuations absurd, sand usage trends concerning, new supply robust and the end result being a bunch of bankruptcies.

His short thesis has certainly worked so far given the share price moves of late.  Obviously, time will tell if his vision for business results actually plays out.

How Leveraged Are These Companies?

Unquestionably there was a lot of growth factored into the valuations of these companies back in February at the peak.

There still is with the group trading at pretty high multiples of EBITDA.

But Loeb isn’t just saying that the companies are expensive.  He is saying that many of them are going to zero.

To try and assess that risk, I dug back into the most recent 10Qs for Hi-Crush (HCLP-NYSE), Fairmount Santrol (FMSA-NYSE), Emerge Energy (EMES-NYSE) and U.S. Silica (SLCA-NYSE).

Against each company’s net debt I have annualized the Q1 2017 run-rate of EBITDA (earnings before interest, taxes, depreciation and amortization).  Here is how they look:

Ticker Company Net Debt Q1 EBITDA     x 4 Debt / EBITDA
SLCA U.S. Silica $0.0 $165.20 n/a
EMES Emerge Energy $152.0 $2.72 55.9
HCLP Hi-Crush $114.0 $7.60 15.0
FMSA Fairmount Santrol $578.0 $73.60 7.9

There is quite a range of leverage for this group.  At one end of the spectrum we have U.S. Silica that is sitting with a $200 million of net cash, so no debt concerns whatsoever.

Then we have everyone else…….who range from a lot of leverage to a ridiculous amount.

Now bear in mind that this is relative to Q1 2017 and there is a lot of growth expected over the next nine months in EBITDA for all of these companies.  I’ve looked at all of the analyst reports and most are calling for EBITDA levels to triple by Q4.

If that happens, those leverage ratios look completely different.

Loeb’s belief is that the expected EBITDA growth is not going to materialize.

If he is correct that would mean that the three companies other than U.S. Silica are going to find themselves with balance sheets that aren’t built for the cash flows they have.

Again, that is if Loeb is correct.  The consensus analyst view is much more bullish on EBITDA growth over the rest of this year (and into the future).

For some additional color I’ve also provided a view of net debt versus Q1 2017 revenue (annualized) for the group.

Ticker Company Net Debt Q1 Revenue     x 4 Debt / Revenue
SLCA U.S. Silica $0.0 $976.00 n/a
EMES Emerge Energy $152.0 $301.20 0.5
HCLP Hi-Crush $114.0 $333.60 0.3
FMSA Fairmount Santrol $578.0 $692.00 0.8

With this view you can see that Emerge and Hi-Crush don’t look as bad as they did relative to EBITDA.  For those companies small margin improvements could add significantly to EBITDA.

Fairmount Santrol meanwhile has net debt that almost equals Q1’s annualized revenue and is clearly in need of some growth.

Loeb May Have Already Cashed Out

Loeb’s bearish words were from his Q1 letter to investors.  It is entirely possible that he has already closed out his short trade on this sector.

If he has, good for him because he made a lot of money in a hurry.

If he hasn’t it means he has some serious conviction that frac sand stocks will end in heartache for investors.

If Frac Sand is So Hot—Why Are Sand Stocks So Cold?

0

It has been a rough couple of months for the shareholders of the big four frac sand suppliers.

At the start of 2017 everyone–including me–was buying into the bullish story for these companies based on the industry trend of sand, sand and more sand.  Sand has been the #1 efficiency driver for the North American oil and gas industry.

But take a look at what has happened to this sector from the peak in February until now:

Ticker Company 2017 Share Price Peak Current Share Price Decline % Decline
SLCA U.S. Silica $61.49 $37.39 $24.10 39%
EMES Emerge Energy $24.45 $11.19 $13.26 54%
HCLP Hi-Crush $23.30 $13.37 $9.93 43%
FMSA Fairmount Santrol $13.12 $5.00 $8.12 62%

The average share price decline for this group of companies over a period of just 3 months is 49 percent.  What exactly was it about first quarter numbers that the market hated so much?

Let’s do some digging.

Frac Sand Q1 – Significant Volume and Revenue Growth

When looking for answers I always do the same thing.

Head on over to the SEC website and drill into the some 10Qs and 10Ks.

People tell stories, the numbers tell the story.

The average share price of the big four frac sand companies has been cut in half since February, so how disappointing are the Q1 numbers from 2017 compared to Q1 2016?

The first thing I looked at were sales volumes, as in how much proppant these companies actually sold.  Here is what I found:

Ticker Company Q1 ’17 Volumes Q1 ’16 Volumes Increase % Increase
SLCA U.S. Silica 3,393 2,273 1,120 49%
EMES Emerge Energy 1,251 439 812 185%
HCLP Hi-Crush 1,381 962 419 44%
FMSA Fairmount Santrol 2,700 2,100 600 29%

All of the companies sold a lot more sand this year.  The range of increases was 29 percent at the low end to 185% at the high end.

Clearly demand has increased quite dramatically year on year.

But what about pricing?  Perhaps volumes increased but there was not a similar increase in revenues?

Not true.  Check out Q1 2017 vs Q1 2016 revenues for this group:

Ticker Company Q1 ’17 Revenue Q1 ’16 Revenue Increase % Increase
SLCA U.S. Silica $244.0 $122.5 $121.50 99%
EMES Emerge Energy $75.3 $29.7 $45.60 154%
HCLP Hi-Crush $83.4 $52.1 $31.30 60%
FMSA Fairmount Santrol $173.0 $145.0 $28.00 19%

Again big percentage jumps year on year.

Without knowing that the share prices of these companies have collapsed, you would never have expected it to have happened from just looking at the growth in revenue.

Demand for sand is growing and it is growing very fast.  The sales volumes of these companies reflect that and so do their revenues.

Oil and gas producers confirm it too.  They just keep using more and more proppant and keep getting better results because of it.  More sand has meant higher initial production rates, lower declines and improved economics.

a

So what is the problem?

Well, I’ll tell you.  This is a case of investors buying the bullish case for sand hook, line and sinker…..and then deciding to drill into the numbers.

A great future doesn’t appear in just one quarter.

Frac Sand Q1 – When Euphoria Meets Fact

Volumes are up year on year, revenues are up too.  EBITDA for these companies is has also increased, but offers our first hint as to what might be the problem:

Ticker Company Q1 ’17 EBITDA Q1 ’16 EBITDA Increase % Increase
SLCA U.S. Silica $41.3 $0.3 $41.0 13667%
EMES Emerge Energy $0.7 ($9.5) $10.2 n/a
HCLP Hi-Crush $1.9 ($11.2) $13.1 n/a
FMSA Fairmount Santrol $18.4 $8.3 $10.1 122%

All of these companies have had significant EBITDA improvements in the first quarter of 2017.  But if you look at the actual numbers you will likely notice something.

These companies aren’t making much money.

Two of them have EBITDA that is barely positive and the other two aren’t huge numbers either, especially relative to their market valuations.

This is where euphoria meets fact…….and fact tempers euphoria.

The long term case for frac sand demand is an extremely compelling one.  Investors can see rig counts increasing and proppant loads per well increasing even more.  Throw in the thoughts of a bit of an oil price increase and it isn’t hard to get very excited.

When investors get excited they bid up prices.  That is what happened to the frac sand suppliers through February of this year.  Excitement resulted in the valuations of these companies factoring in a lot of future growth that has yet to happen.

The table below shows the enterprise value of these four companies relative to their Q1 EBITDA levels annualized.

Ticker Company Q1 ’17 EBITDA Q1 EBITDA     x 4 Ent Value Ent Value / EBITDA
SLCA U.S. Silica $41.3 $165.20 $2,873 17.4
EMES Emerge Energy $0.7 $2.72 $491 180.5
HCLP Hi-Crush $1.9 $7.60 $1,369 180.1
FMSA Fairmount Santrol $18.4 $73.60 $1,722 23.4

Those are some pretty large multiples of EBITDA and remember, this is after these companies have had their share prices whacked in half.

Before the selloff the valuations of these companies were really optimistic.

Reality Check Yes – But Has The Long Term Really Changed?

When these stocks peaked earlier this year there was a huge amount of growth baked into their share prices –a massive amount of growth.

The Big Change came when the quarterlies of these Big 4 sand producers were issued.  They all talked to sand fundamentals being strong, but their quarterly cash flow didn’t meet expectations.

Missing estimates forced the market to do a reality check, and concerns over surprisingly fast increases in new sand supply added to the concern.

This is what happens when huge growth expectations get factored in and multiples on the stocks in a sector get really big.  It doesn’t take much doubt to cause a big share price reaction.

The reality is though that long term growth story for these sector likely hasn’t changed much.

The trend to use MORE sand is STILL continuing, so I’m a bit surprised these stocks have been hit so hard.

These increases in sand are indicative of pretty much every play in North America…and it is paying off in higher IP rates and lower declines.

Going forward, The Big Money in the oil patch isn’t going to be spent in the deepwater, it isn’t going to be spent in the oil sands.

It is going to be going to be spent drilling and fracing onshore horizontal wells.

The future here is still bright.

Figuring out the right price to pay for the growth that is coming is the tricky part.

The Biggest “Blue” Sky in Energy is Right Here

0

Investors have made HUGE capital gains in the last decade in energy metals—think uranium in 2007-2008, lithium in 2011 and lithium again in 2016.

In 2007 I owned a large position in a junior uranium stock that went from 25 cents to $2.50.  Last year I owned a lithium stock that went from 30 cents to $2.80.

There’s going to be another big run in an energy metal in 2017-2018—and like lithium this will be driven by demand from Electric Vehicles—EVs.

This year, it’s going to be COBALT—the blue metal.

I’m certain very few of you know anything about cobalt, even though it’s already in almost every personal electronic device to which we have become addicted.  You’re probably within three feet of cobalt right now.  That’s just a taste of how much the world uses.

Add the rapidly growing global market for EVs onto that steadily increasing demand…and the cobalt market gets very interesting…for everybody: suppliers, end users and investors.

That’s certainly what this cobalt price chart is saying:

A

To me, the interesting thing about the 150% price rise in the chart is…the cobalt market was actually mildly oversupplied last year, producing a few thousand tonnes of excess metal. But investors are clearly looking ahead.

So I’m going to outline the supply, the demand, and most importantly the politics behind cobalt.  (Hint: it’s bullish)

It has one of the highest energy densities of any metal, and as I’ll explain to you, it is just as essential to electric batteries as lithium—and once you understand the politics of cobalt, you may arrive at the same conclusion as me:

Cobalt supply is much precarious than any other metal in the EV supply chain.  And that should make the price increases be potentially even higher.  Getting a large supply of ethical cobalt is not easy.

And then at the very end, I’ll tell you how I intend to profit from cobalt.  Investing in this space is much more difficult than I expected—because there aren’t any cobalt mines.

I’ll outline worldwide cobalt demand first.

Cobalt is a hard, lustrous metal that sits between iron and nickel on the periodic table. Its key characteristics – a high melting point, high energy density, and ferromagnetism – make it perfect for two things: battery cathodes and superalloys.

Superalloy demand for cobalt will keep rising slowly. The battery market, on the other hand, is ravenous.

Caspar Rawles is the cobalt analyst at Benchmark Mineral Intelligence in London England.  His is the only firm that specializes in collecting price data from the battery supply chain for the EV industry.

In a recent phone interview, he told me their data shows a big demand jump for the next decade:

“In numbers…the 2016 the battery cobalt demand was about 48,000 tons and by 2020 we’ll have grown into that 75,000 tons.  It’s a big growth. The key thing is that’s relative quick…but it will probably be quicker between 2021 and 2025. We then think the battery demand will be closer to like 123,000 tons in 2025 and so it’s quite a steep curve.”

Macquarie is one of the largest merchant banks/brokerages in the commodities space.  Here’s how they see cobalt demand:

B

Says Macquarie: “Cobalt’s demand growth profile remains one of the best among industrial metals peers. Its exposure to rechargeable batteries continues to play a crucial role.”

The driver here is electric vehicles. In Beijing, Mexico City, Lahore, New Delhi, Moscow, Guatemala, Istanbul, Los Angeles, and beyond, people are choking to death on smog. That is why the governments of 14 countries are collectively targeting 13 million electric vehicles in circulation by 2020.

That’s a five-fold increase. And it’s possible because, after being prohibitively expensive for years, battery costs have come dramatically, so much that we are now at the tipping point where electric vehicles are cost-competitive with regular cars.

To supply the huge demand that comes from outfitting millions and millions of new EVs, the world needs a lot of batteries. We’ve all heard about Tesla’s gigafactory in Nevada, but in fact there are 12 such gigafactories being built around the world.

Those 12 gigafactories will need an immense amount of cobalt.

Cobalt also drives the batteries in most devices, from laptops to phones. It also powers tools and lights.  The reason for ALL of this: no other battery chemical comes close to cobalt’s energy density, longevity, and safety.

That’s why cobalt production has gone almost straight up in the last 20 years.

C

Now we’re talking about supply, and this is where cobalt gets REALLY interesting.

As EV battery demand rises and rises, I think cobalt supply will struggle to keep up—for three reasons:

  1. Almost two-thirds of the world’s cobalt comes from the Democratic Republic of Congo, or DRC. This brings up both political and ethical issues; mining companies are under huge pressure not to use conflict minerals.
  2. More than half of mined cobalt is refined in China—who need a lot of cobalt themselves.
  3. And to make things more fragile, 98% of cobalt is produced as by-product from nickel and copper mines. That means it is very hard to increase cobalt output – it is totally dependent on the economics of other metals.

That means cobalt supply hinges on a highly unstable country (DRC) while refining requires the Chinese – who need a lot of cobalt themselves – to play ball.

Now we get into the politics.  Analyst Rawles from Benchmark says these are real concerns—for everybody.

“Security of supply is definitely the biggest concern. Everyone in the supply chain people want to lock up long term supply contracts because they’re concerned they won’t have the source of material. If they have to buy in the spot market it’s very, very expensive compared to what they’d be paying on the long term price contracts.”

Spot prices for cobalt can be almost 50% higher than contract prices, Rawles added, telling me about one producer who had a contract to sell at $21/pound but was selling spot at $30/lb.

So right away the Market is seeing some price tension.

Over 60% of the world’s cobalt comes from the Democratic Republic of Congo. Three-quarters comes as a by-product from copper or nickel mines where production is only as secure as the host country.

The other 25% of Congo’s cobalt is mined “artisanally”, which means it comes from small mines that are often very unsafe.

Thousands of under-age workers are used, sent down into hand-dug tunnels and shafts that can and do collapse—to pull out bags of rock. Several media stories have exposed this practice.

This is starting to change. In early March, Apple stopped buying cobalt mined by hand in the Congo, saying all small mine suppliers will have to meet its workplace standards. Other companies have made similar noises.

The question is: if major companies move to cut out the Congo, where will they get their cobalt?

Rawles says it’s a tough question for the industry.

“The problem with projects outside the DRC is that they’re small. So when..say…60 large companies say we’re not going to use DRC cobalt, that can’t happen. It’s just not going to happen because the projects aren’t there.”

He says no other country produces even 10% of the world’s cobalt supply.

Now, we haven’t even got to China yet.  They refine just over 50% (~52%) of the world’s cobalt, and Rawles says that could potentially jump to 62% with some of their recent acquisitions in the space.

The concentration of refining capacity in China “is certainly a point of concern” for the industry, says Rawles, but adds they view it as a shared risk amongst themselves.

The investment world is taking notice. High-profile investment funds like Switzerland’s Pala Investments and China’s Shanghai Chaos Investment are so convinced a supply shortage will send cobalt’s prices through the roof that they have already started stockpiling cobalt metal.

If the price more than doubles and investment banks start stockpiling metal in expectation of a tight market, what will happen when the market is actually in deficit??

Since 98% of cobalt comes as a by-product from copper and nickel mines, it’s tough to increase production. Planned new mines might be able to meet demand…if everything goes according to plan.

That’s a rarity when it comes to building mines. Any supply disruption will cause cobalt prices to spike. And when 64% of supply comes from the Congo, 50% is refined in China, and 98% comes as a byproduct, disruptions are almost guaranteed.

That is why more secure supplies – from mines outside of the Congo or from dedicated and responsible new cobalt producers, for example – would be very welcome news to cobalt consumers.

That’s my segue to tell you my idea on how to profit from cobalt.  I’ll explain it in detail in my next story.

Get Paid by the Permian’s Fastest-Growing Landlord

0

A Six Percent And Growing Royalty On Surging Permian Production

At this point I’m sure you are familiar with charts like the one below.

This chart shows where production in the Permian Basin is going over the next four or five years.
a

This is the chart from one analyst.  I can show you five more like it from the next five analysts.  Where Permian production is going is a mystery to no one at this point.

Today the Permian is producing a little more than two million barrels of oil per day.  By 2020 it will be over 4.5 million barrels of oil per day.  That is truly a spectacular rate of growth.

And these are conservative projections by the way.  This is assuming that we don’t get a recovery in oil prices.  It also assumes that the industry doesn’t keep getting better at drilling wells.

Can you imagine what that growth curve might look like with $60, $70 or $80 per barrel oil?

This Permian growth is not a secret.  What is a little more complicated is determining the best way to profit from it.

I’m certain I can help with that.

I’ve uncovered a company that literally gets paid a royalty based on how much production is coming out of the Permian.  This isn’t a leveraged producer that may or may not actually generate positive cash flow while growing production.

This is a different kind of business model.  In fact this is the perfect business model.

Tell me how this sounds….

This company has no debt, only a few employees and virtually no expenses.  The only thing that this company needs to do is cash the royalty checks that keep arriving in the mail each and every month.

As I said, this is literally a royalty on Permian production.

This is the ultimate high margin business that gushes cash flow and is perfect for paying a large and growing dividend.

With No Spending Requirements – All Cash Goes To Shareholders

The beautiful thing about this business is that there is only one thing to do with all of the cash that is generated.  It gets paid to shareholders through a growing dividend.

Today the company yields over 6 percent.  This is with sub $50 oil and current levels of Permian production.

As Permian production grows that dividend is going to increase.

It is going to increase a lot.

But even more than you know.

As I said this company has a royalty on Permian production.  That royalty is not on all of the Permian.

It is on a select portion of the core of the Permian.  An area that is growing much faster than the Permian as a whole.

So while the Permian in total more than doubles production in the next four years, the production that this company generates its royalty from is going to do a lot better.

Today the dividend yield on this company is 6 percent.  With production growing faster than the entire Permian you can extrapolate for yourself what that will mean for where this dividend is headed.

There are no other opportunities like this one in the market today.

No debt.

Highly aligned management.

A 6 percent and rapidly growing dividend.

Virtually no expenses.

Growth, safety, yield……this one has it all.

Clearly with a 6 percent yield and no debt the market hasn’t found this company yet.  It will and when it does that yield will shrink as the company’s share price increases.

So here is your opportunity to lock in that 6 percent yield before the market takes it away from you….

Click here….

The Single Best Oil Stock For This Market

0

Great Investors Share One Trait – They Wait For The Fat Pitch

(Exactly Like This One)

If you want to be a really good investor, you need to be able to do one thing really well:

Sit on your hands and do nothing.

It sounds easy, but it is the hardest thing in the world to do when investing.

I’ve studied the great investors and all of them share this one attribute.  They are patient and willing to sit on the sidelines for long stretches.

Until they are certain that it is time to act.

Warren Buffett has this attribute in spades.

He describes it by saying that “I don’t try to jump over 7 foot bars, instead wait for a 1 foot bar that I can step over”.

a


Now I’m not Warren Buffet.

In fact, I’m very impatient.  But I am right now sitting on more cash than I have in years…maybe ever.

I’m waiting…until an opportunity comes along that is so good that I am absolutely certain that it will be a huge success.

I want to be literally trembling with greed at the chance to buy a specific stock–A Fat Pitch.

Now is that time.

7 Percent Yield, Rapid Growth, No Debt – A Fat Pitch Is At Hand

I’m done waiting.  I’ve found it–but what exactly does a Fat Pitch look like?

What is it that spurs a great investor like Buffett to finally act?

I study energy stocks 24/7/365, and in my 9 years I have never seen a company this good:

Attribute #1 – A debt free balance sheet
Attribute #2 – A seven percent–and growing–dividend.  (They just announced ANOTHER dividend increase this quarter!)
Attribute #3 – Absolutely no capital spending
Attribute #4 – The highest margin business I’ve ever seen
Attribute #5 – Years of near certain double digit growth

How many companies do you know of that have no debt, a six percent dividend yield and the ability to grow that dividend for years into the future?

I suspect your answer would be zero.

But I know one–and only one.  It’s a unique company.  There is literally nobody else in the global energy patch doing what they do.  And that’s what I specialize in–finding these oddball companies, that aren’t the traditional producers that everyone else thinks about when they think energy stocks.

Fat pitches like this don’t come around often and they don’t last for very long.

After weeks of doing nothing, the time to act is now.  Click HERE to get this stock working for you.

SHORT NATGAS ETF–UNG-NYSE

0

IS THE TIME RIGHT TO SHORT NATURAL GAS?

 
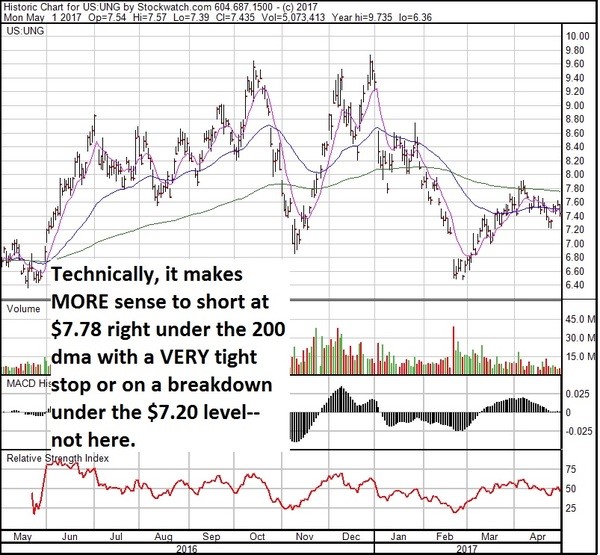
Is it time to short natural gas?  I think the time is close.  I got short UNG-NYSE yesterday–the very liquid natgas ETF.

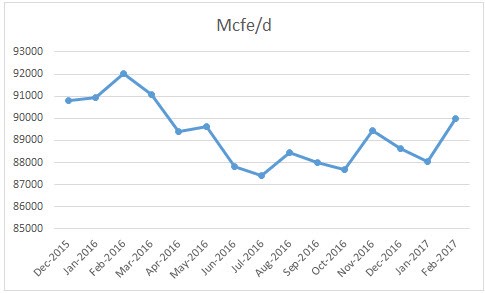
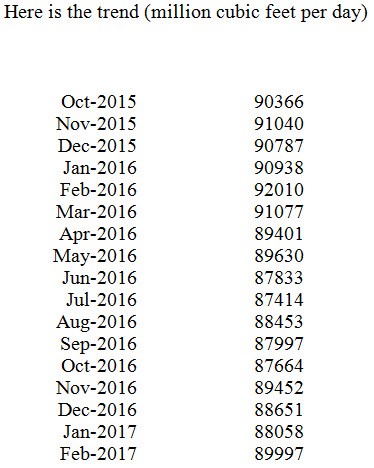
In last Thursday’s monthly EIA 914 report, US natgas production rose; in fact it was the biggest jump in production from the Lower 48 in three years—up 1.8 bcf/d from Jan to Feb at 80.2 bcf/d.


a


a 2

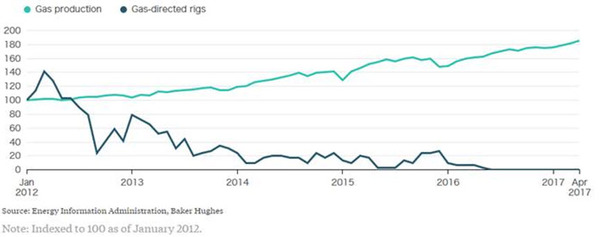
Even Texas finally jumped in production—where the increase from associated gas from the Permian was more than the decline in natgas from the rest of the state—particularly the Eagle Ford.  The chart below shows the Permian with ZERO natgas directed rigs producing a lot of gas!


Permian gas rigs to zero production up 1 bcfd


Most natgas watchers are calling for an increase in production this year in the US, anywhere from 1-4 bcf/d by year end, and another 2-4 bcf/d next year.

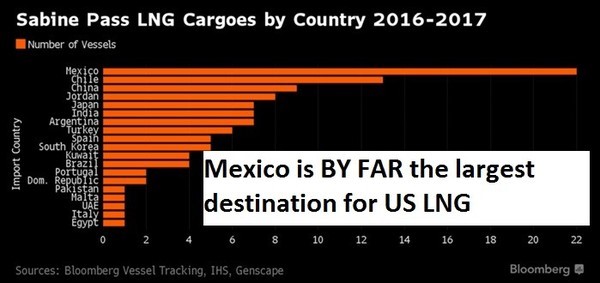
There’s one other factor I think the Street is missing—LNG exports to Mexico.  The natgas bulls say LNG exports and Mexican exports are strong this year and will continue to grow. But Mexican natgas use overall is flat to marginally down.  Now have a look at where US natgas LNG exports are going:

a 3


To me, that makes the US export game a little more zero sum than the Market appreciates—every LNG carrier to Mexico is less pipeline flows, and vice versa.  Mexico consumption is flat and they don’t re-export LNG.

The other Big Bearish Fundamental is the natgas rig count, which has now more than doubled off the bottom last year to 171 rigs. These new big rigs are so efficient, it likely only takes 110-120 rigs to keep US production steady right now…and if efficiencies keep improving, it will be less in future years.

natgas rig count--Ycharts May 1 17

Source: Ycharts.com

That’s A LOT of extra rigs! In 2016, the US onshore natural gas rig count averaged just 101 rigs and EIA data does show a drop in natgas production–but only by 2.74 bcf/d or 3.69%.  My research team dug into the data, and guesstimated that 0.9 BCF/d of that came from declining crude oil production (associated gas), and 0.15 BCF/d from declining FGOM production. This leaves year-end, dry natural gas production–from onshore gas wells down just 1.67 BCF/d, or 2.26%. That’s from 101 rigs…so the current 171 rigs should swamp production estimates.

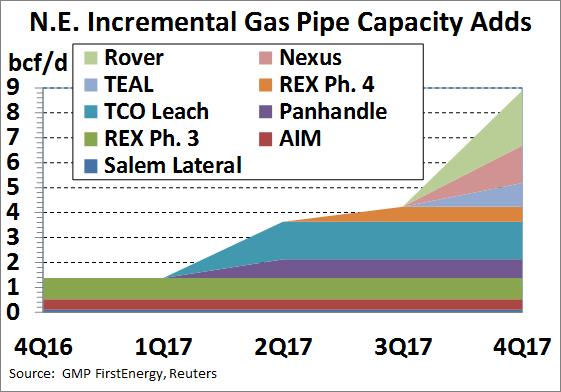
And this is the year when there will finally be enough new pipeline capacity out of the US Northeast (Marcellus) to get all that low cost gas to market.  Here is a chart showing new pipelines and when they’re due:

Marcellus pipeline expansion 2017 First Energy Dec 16


And higher prices this year–about $1/mcf over last year–is reducing demand.  Power burn is down about 4 bcf/d this year, which is almost certainly price driven (meaning higher prices reduced demand; that’s how the Market works ;-)).  This winter was not that much warmer if at all over the previous one.

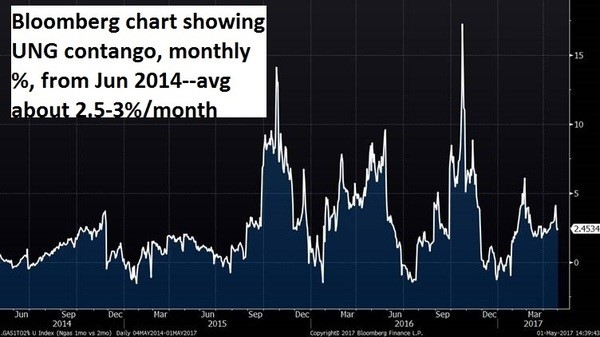
There’s also a bonus for investors shorting UNG-NYSE, the major ETF for natgas–there is a 2.6% front month contango on UNG right now–though it has been in that region for over two years–it was 2.3% in 2015 and 3.43% last year–and running ahead of last year’s so if natgas stays flat here at $3.25, the price of the ETF should fall 2.5-3% each month.

 a 4


For me, by definition, a short is a short-term trade—maybe up to one month.  It is not an investment.  If I think about shorting natgas, it’s 1-3 month trade for me.


STOCK CHART

a 5

 
Shorting isn’t for everyone.  A riskier investment is getting long DGAZ, the 3x short natgas ETN that also has lots of liquidity.  It’s only really good for super short term moves—like a few days—and I don’t know how long it will take for natgas to really roll over.