
IS THE TIME RIGHT TO SHORT NATURAL GAS?
Is it time to short natural gas? I think the time is close. I got short UNG-NYSE yesterday–the very liquid natgas ETF.
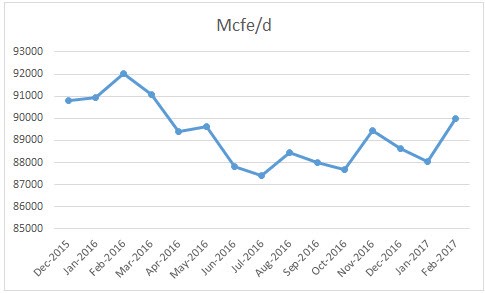
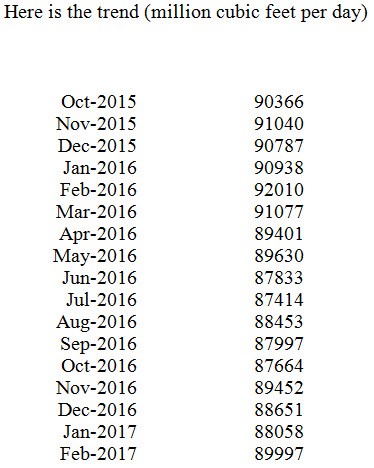
In last Thursday’s monthly EIA 914 report, US natgas production rose; in fact it was the biggest jump in production from the Lower 48 in three years—up 1.8 bcf/d from Jan to Feb at 80.2 bcf/d.
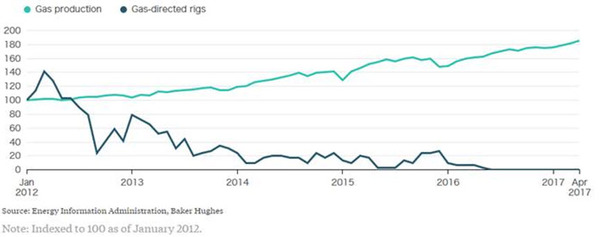
Even Texas finally jumped in production—where the increase from associated gas from the Permian was more than the decline in natgas from the rest of the state—particularly the Eagle Ford. The chart below shows the Permian with ZERO natgas directed rigs producing a lot of gas!
Most natgas watchers are calling for an increase in production this year in the US, anywhere from 1-4 bcf/d by year end, and another 2-4 bcf/d next year.
There’s one other factor I think the Street is missing—LNG exports to Mexico. The natgas bulls say LNG exports and Mexican exports are strong this year and will continue to grow. But Mexican natgas use overall is flat to marginally down. Now have a look at where US natgas LNG exports are going:
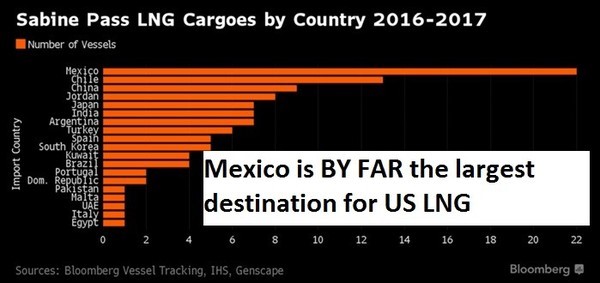
To me, that makes the US export game a little more zero sum than the Market appreciates—every LNG carrier to Mexico is less pipeline flows, and vice versa. Mexico consumption is flat and they don’t re-export LNG.
The other Big Bearish Fundamental is the natgas rig count, which has now more than doubled off the bottom last year to 171 rigs. These new big rigs are so efficient, it likely only takes 110-120 rigs to keep US production steady right now…and if efficiencies keep improving, it will be less in future years.
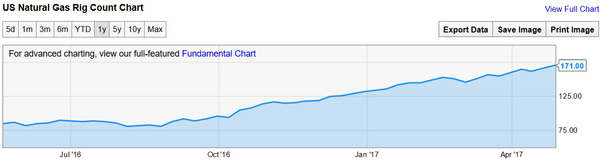
Source: Ycharts.com
That’s A LOT of extra rigs! In 2016, the US onshore natural gas rig count averaged just 101 rigs and EIA data does show a drop in natgas production–but only by 2.74 bcf/d or 3.69%. My research team dug into the data, and guesstimated that 0.9 BCF/d of that came from declining crude oil production (associated gas), and 0.15 BCF/d from declining FGOM production. This leaves year-end, dry natural gas production–from onshore gas wells down just 1.67 BCF/d, or 2.26%. That’s from 101 rigs…so the current 171 rigs should swamp production estimates.
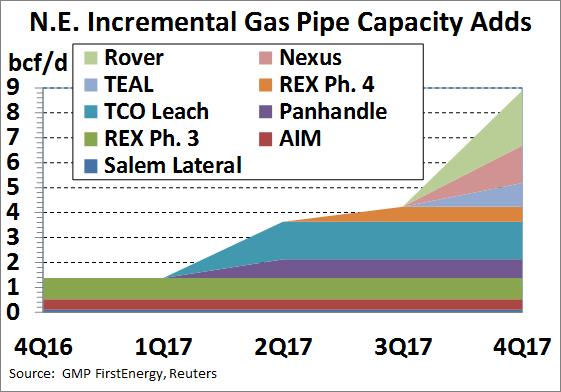
And this is the year when there will finally be enough new pipeline capacity out of the US Northeast (Marcellus) to get all that low cost gas to market. Here is a chart showing new pipelines and when they’re due:
And higher prices this year–about $1/mcf over last year–is reducing demand. Power burn is down about 4 bcf/d this year, which is almost certainly price driven (meaning higher prices reduced demand; that’s how the Market works ;-)). This winter was not that much warmer if at all over the previous one.
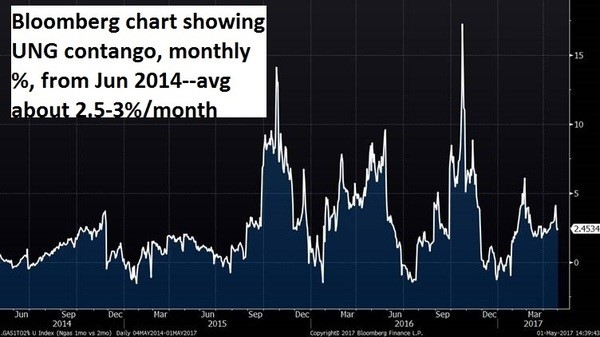
There’s also a bonus for investors shorting UNG-NYSE, the major ETF for natgas–there is a 2.6% front month contango on UNG right now–though it has been in that region for over two years–it was 2.3% in 2015 and 3.43% last year–and running ahead of last year’s so if natgas stays flat here at $3.25, the price of the ETF should fall 2.5-3% each month.
For me, by definition, a short is a short-term trade—maybe up to one month. It is not an investment. If I think about shorting natgas, it’s 1-3 month trade for me.
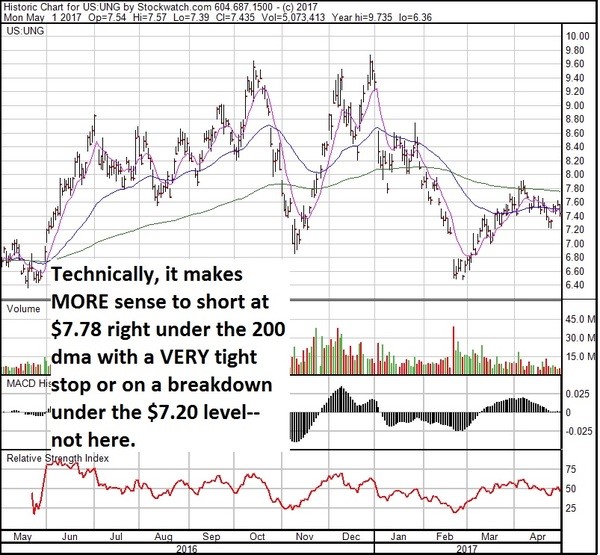
STOCK CHART
Shorting isn’t for everyone. A riskier investment is getting long DGAZ, the 3x short natgas ETN that also has lots of liquidity. It’s only really good for super short term moves—like a few days—and I don’t know how long it will take for natgas to really roll over.

 VS. TECHNICALS (GOOD)")

")


 THE ONLY COMPANY TO REVERSE LATE STAGE LIVER DISEASE WHAT’S THAT WORTH?")
")