If free cash flow is King – then you can hand Canadian Natural Resources (CNQ-NYSE/TSX) the crown.
Generating free cash flow in the oil and gas production business is very difficult. Canadian Natural makes it look incredibly easy.
Let me be clear on what I’m talking about when I say free cash flow.
This is the cash flow that a company generates in excess of its capital spending requirements.
Free cash flow is what’s left-over after a company has invested enough to maintain the existing production level of the company.
Free cash flow is the cash that a company has available to pay dividends, repurchase shares, accelerate growth, reduce debt or just fatten up the bank account.
Free cash flow has always been at the core of Warren Buffett’s investing approach. Buffett refers to free cash flow as “owner earnings” – where he compares the amount of cash that a business produces relative to the amount of cash it needs to maintain the business.
Buffett’s Owner Earnings = Cash flow produced less capital expenditures.
Canadian Natural Resources – Gushing Free Cash Flow
Every management team in oil & gas will tell you that they have the best assets. Let me tell you, I’ve heard them all do it.
All of the companies can put together very compelling and convincing corporate presentations to back those claims up.
That is why I love numbers.
Cold, hard, numbers… especially cash flow numbers. Because you can’t fake cash flow.
Taking a dive into Canadian Natural’s Q3 financial statements that were just released tells you everything you need to know about this company’s assets. They are very different than what I’m used to seeing in this capital intensive industry.
Through the first three quarters of 2018 Canadian Natural has generated $7.9 billion in funds flow from operations. To maintain (and actually grow) production Canadian Natural will spend $3.2 billion to do it.

That means that in the first 9 months of 2018 Canadian Natural generated $4.7 billion in free cash flow. The true “owner earnings” figure that Buffett would look at is actually be higher than that since he wouldn’t factor in capital spending on growth.
The free cash flow that Canadian Natural has generated in 2018 is cash flow that the company can allocate as it sees fit.
In 2018 that allocation has been:
Dividends – $1.2 billion
Share Repurchases – $900 million
Balance Sheet Improvement – $2.6 billion
A very telling statistic is that the dividend yield from this $1.2 billion in dividend payments is 3.8%… yet even with that big yield the company was able to allocate 3 times more cash towards share repurchases and the balance sheet.
Canadian Natural is gushing free cash flow.
And despite massively underspending the amount of cash flow that it generates… CNQ still grows production at an impressive rate.

Over the past five years the company is at the head of the pack when it comes to a compounded rate of production growth.
More Number Crunching – Compare Cash Flow To Valuation
A great way to look at Canadian Natural’s current market valuation is to think about how long it would take for the company to repurchase all of its outstanding shares (assuming the current share price).
At the end of Q3 2018 Canadian Natural has 1.2 billion shares outstanding.
With the company’s share price bouncing around $35 per share that means that the market capitalization for Canadian Natural is $42 billion.
Next year Canadian Natural has provided a range of cash flow from operations guidance that factors in worst case WCS differentials to better case WCS differentials.
That cash flow guidance range goes from $6.6 billion at the low end to $9.3 billion at the high end. But it gets better – note that through three quarters of 2018 Canadian Natural was on pace for $10.5 billion of cash flow from operations this year.

From those operating cash flow figures I’ll deduct the $3.1 billion of maintenance capital spending that needs to be done to sustain production.
That gives me these three free cash flow (operating cash flow – maintenance capex) figures:
2019 Worst case – $6.6 billion less $3.1 billion = $3.5 billion
2019 Best case – $9.3 billion less $3.1 billion = $6.2 billion
Q3 2018 run-rate case – $10.5 billion less $3.1 billion = $7.4 billion
If Canadian Natural were to choose to hold production steady and plow all of that free cash flow into share repurchases….
At the current share price of $35 it would take the company this long to repurchase 100% of its outstanding shares:
With $3.5 billion of free cash flow —- $42 billion / $3.5 billion = 12 years
With $6.2 billion of free cash flow —- $42 billion / $6.2 billion = 6.7 years
With $7.4 billion of free cash flow —- $42 billion / $7.4 billion = 5.7 years
Those are some pretty incredible numbers… even the worst case scenario.
I find the numbers especially incredible when you consider that at the point when all of the shares had been repurchased that last remaining shareholder would be sitting on a company that had maintained production at current levels and still had another 8 billion barrels of oil to produce in the years ahead.

What is the secret to Canadian Natural’s massive free cash flow story?
It is all about the company’s incredibly low production decline rate. With zero capital being invested, CNQ’s production would only decline by 10 percent per year.
That means that the company has to spend very little to maintain existing production and just a little more to grow it.
That leaves all of that excess cash flow to be used in whatever manner Canadian Natural’s leadership believes is in the best interests of the shareholders that they serve.


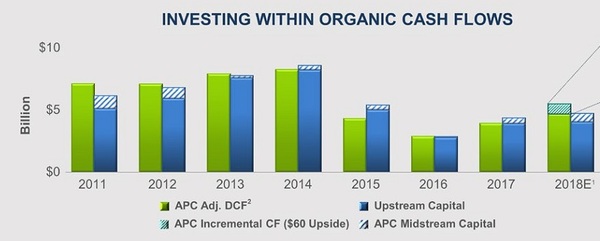
Compare that to a competitor like Anadarko Petroleum (NYSE:APC) which has generated no free cash flow to speak of over the past eight years combined (see the APC slide below). The difference between the green bar and the blue bar in each year = free cash flow. Investors want to see the green bar be MUCH higher than the blue one.

Canadian Natural generates billions of dollars of free cash flow each and every year. This shows the huge advantage that Canadian Natural’s low decline production creates.
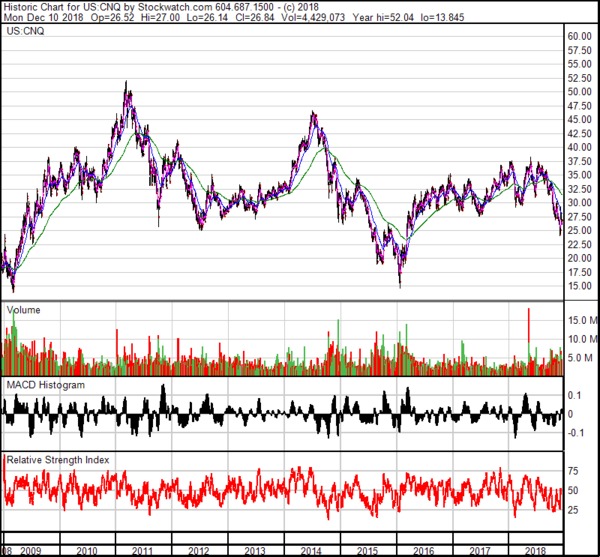
The stock has only been lower than the current price twice – once in 2015 after the Saudis pulled the rug out from under the world oil market, and once in late 2008-early 2009 when investors feared for their financial lives.

The King of Free Cash Flow is a lot stronger than its stock price would suggest. And with heavy oil differentials now reverting to a normal $15/barrel discount (saved by the gov’t!?), their strong cash flows look to continue.
Keith Schaefer


