THE 2024 TRADE THAT WILL KEEP GIVING ALL YEAR

0

If you think interest rates don’t have much farther to fall (after a fast 20% jump in TLT-NYSE), have a look at the last decade of REAL interest rates in this chart:

ITM TLT trade FRED real interest rates Dc 7 23

REAL interest rates are as high as they have ever been–even after the Street has started pricing in lower intersest rates for the last 5 weeks!

To me and my colleague Nathan Weiss, that makes the 20+ Year Treasury Bond ETF (TLT-NYSE) an InTheMoney bank trade–likely for most of 2024 as well.

This is the second options trade on TLT for Nathan Weiss and myself in the last month.  The first trade–on Nov 18–we advised our readers to write December 15th, $85.00 covered calls on TLT shares, earning a 1.46% return as long as TLT shares are trading at or above $85.00 when the options expire–a 17.5% annualized return.

Nathan Weiss and I have teamed up to create a new research service – InTheMoney – which seeks to earn low-risk, consistent 1.5% to 2.0% (or more) monthly returns with covered calls and puts.  We generally publish trades monthly, and you see our first trade above. (You can read this story on our website, inthemoney.capital)

We believe Treasury prices have made/are making a cycle low and owning the TLT outright and writing calls against a portion of our position gives us 1) medium/long term upside and 2) 1-2% per month extra income.

TLT is once again functioning as a hedge against the economy. So if you were concerned about a major economic contraction, the TLT is a good strategic way to express that view.

That idea is getting popular and TLT is running up lately, so if our shares get called away–we can buy more and write more calls almost immediately! We do see TLT potentially at $120 a year from now—BUT—if the economy heats up again or if war causes oil to go to $120/b and TLT ends up mostly unchanged, our InTheMoney covered call strategy can still generate up to 20% returns.  THAT is the primary benefit of writing covered calls!

Here’s the December trade, with more colour commentary below:

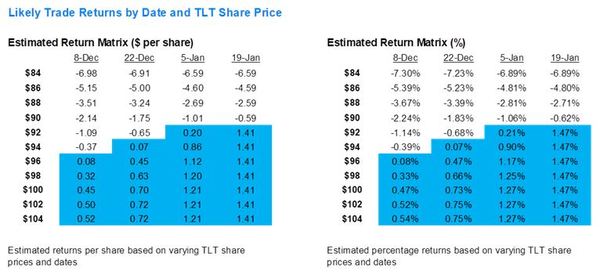
Buy the iShares 20+ Year Treasury Bond ETF (TLT), Sell January 19th, $92.00 Calls against the long position

TLT dials iShares
Extended Commentary
The iShares 20+ Year Treasury ETF (TLT) holds a portfolio of U.S. Treasury Bonds, providing investors a low expense ratio (.15%) and a 3.69% dividend yield.We believe Treasury prices have made/are making a cycle low: Treasury prices generally bottom when the Fed is done raising rates and following the most recent FOMC meeting, Fed Funds futures show investors believe the Fed’s next move will be to cut rates. Also, investor sentiment became overly negative toward Treasuries in recent weeks and CME data shows Leveraged Funds (speculators) are largely net short Treasury futures.Our covered call trade – buying TLT shares at $95.63 and writing January 19th, $92.00 calls for $4.75 – would generate a 1.47% return (including a $.29 dividend) if TLT shares trade at $92.00 (or above) at the options expiration – a 13.2% annualized return. This is a VERY low risk trade–it breaks even if TLT trades all the way down to $90.59 – $5.04 per share (5.27%) below the current price.
TLT share price iShare
TLT chart iShares1 2

Company Overview

The iShares 20+ Year Treasury Bond ETF seeks to track the investment results of an index composed of U.S. Treasury Bonds with remaining maturities greater than twenty years. The TLT holds 40 different Treasury Bonds and has an average coupon of 2.52% and an effective duration of 16.37 years. The ETF currently trades at a .08% premium to NAV.

Potential Events and Newsflow

CPI: Monthly CPI reports will be released before the open on December 12th and January 11th
U.S. Government Funding: Updates relating to government spending or receipts will impact Treasuries, as will announcements regarding the relative issuance of U.S. debt in December and January (Treasury Refunding)
Speeches: Remarks from FOMC officials have been impacting yields: The market REALLY wants rate cuts
Economic Data: ‘Bad’ economic data is good for Treasury prices (and TLT shares), although REALLY ‘bad’ economic data is bad for Treasury prices (and TLT shares)

Market Exposure/Risk of a 10% Change in Equity Prices (S&P 500)

With a beta of .47, we would expect TLT shares to decline 4.7% if the S&P 500 declined 10.0%, sending the shares to $91.14.  This would result in an anticipated gain of $.55 on the covered call position at expiration – net of the $.29 dividend.  If the S&P 500 rallied 10.0%, TLT shares would likely rally 4.7% (to $100.12) and the covered call trade would realize the maximum gain of $1.41 per share including the dividend, or 1.47%.

How We Like To Execute These InTheMoney Options Trades

Be a little patient – TLT shares have followed a pattern of bigger up days then a smaller down day (or two).

When we write a covered call, we’re buying the security–so obviously we want to buy at lower prices rather than high, but the implied volatility of the option we are selling also matters.  Higher implied volatility = a higher premium for the options we are selling.

Volatility is price-down action–so when a stock goes down, volatility tends to go up, so covered call writers win two ways:  You get to buy the stock at a lower price and write the option for a few cents more.  At InTheMoney, we’re looking to make 2% monthly return, so if we give up 10 or 20 basis points by buying on the wrong day, that’s a meaningful part of our total return.

Finally, we NEVER execute our options trades in the first hour of trading–the spreads are ridiculous, the prices don’t follow models, and the market makers are working hard to capture quarters and dimes from people that unwittingly place market orders.

Forward This Email

Sign Up For Our Next Trade–HERE

STEALTHGAS (GASS – NASDAQ)A SNEAKY PLAY ON LPG?

0

New Lb


On Tuesday morning Stealthgas (GASS – NASDAQ) reported another HUGE quarter.  Adjusted EPS came in at 31c per share – a big beat over average analyst estimates of only 15c per share.

In the last nine months, Stealthgas has tabled adjusted earnings of $1.04 per share.   With the stock trading at a little over $6 that puts it well into the “value” basket with a P/E of under 5x.

Is this a no-brainer buy?   Nothing is ever that easy.  In fact, even though the stock looks really cheap and the outlook could not be better, I’m not sure I am ready to take the plunge in Stealthgas.  If I decide to do it, it will be with a very short leash.

Here’s why.
 

LAND LOCKED BY DROUGHT


Stealthgas owns the largest fleet of small LPG—Liquid Propan and butane—carriers in world.  These are vessels ranging from 3,000 to 8,000 form cubic meter (CBM) in size.   Stealthgas owns 27 LPG vessels with another 6 vessels controlled via JV’s.
 

1

Source: Stealthgas Q2 Investor Presentation
 
LPG is liquified propane and butane.

The seaborne LPG market has grown at a 4.7% clip since 2017.
 

1 2

Source: Dorian LPG Investor Presentation

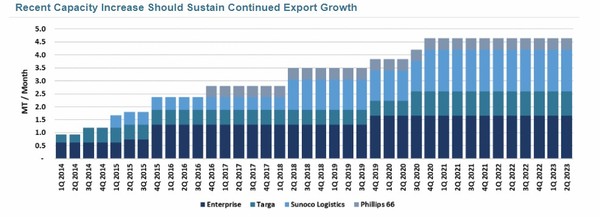
On the supply side, most of that growth has come from the US.  Since 2014 export capacity in the US has grown from under 1 MT/month to over 4 MT/moth.
 

2 2

Source: Dorian LPG Presentation

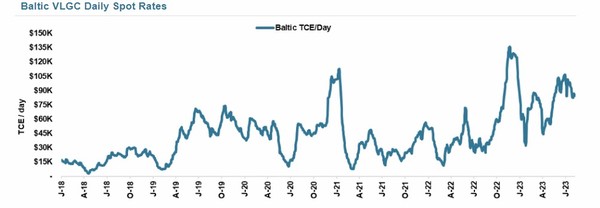
But it’s been a bumpy ride for shippers.   Over the past 10-years rates for VLGCs have been subdued.

3 3

Source: Dorian LPG Presentation

A lot of that was because of the trade dispute between the US and China.   China sanctioned shipments of LPG from the US from August 2018 to March 2020.

Today though, China is growing imports of LPGs A LOT.   China has building propane dehydrogenation plant (PDH) capacity at a fast clip.  So far, Chinese imports of LPGs have increased 22% year-over-year.

The biggest importers of LPGs are Asian countries: Japan, South Korea, China and India top the list.

The big exporters of LPGs are the Middle East countries (Saudi Arabia and Qatar) and the United States.  US Gulf Coast exports of LPGs have increased significantly with shale production.  Today the US Gulf exports nearly 2 MMbbld of LPGs and the US account for 40% of seaborne supply.


2

Source: Dorian LPG Investor Presentation

The fastest way to get LPG shipments from the Gulf Coast to Asia is through the Panama Canal.    Almost all the LPGs go via this route.

But right now, there is a BIG problem.  Panama is having a drought.  The Panama Canal relies on a supply of freshwater for moving up and down the locks.  According to RBN Energy, the canal’s primary reservoir for filling the locks has declined by half since the spring!

Low water levels are limiting the number of ships that can pass through the canal. 

In normal times as many as 40 vessels pass through the locks every day.   That dropped to just 32 vessels in July, and to 24 vessels last week.  The Panama Canal Authority has said that if conditions don’t improve, they will reduce the number of ships through the canal to only 18 a day by February next year!

Adding to the LPG backlog is that LPG carriers (known as very large gas carriers) don’t get priority through the canal.

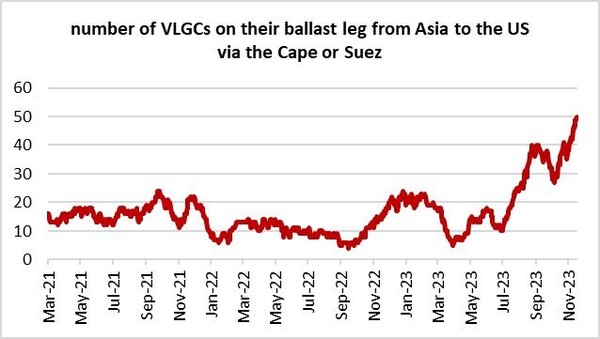
Without access through the Panama Canal, shippers are forced to make a much longer journey via the Middle East Suez Canal or around the southern tip of Africa.  Again, deferring to RBN’s research, a 27 day trip via the Panama Canal increases to 41 days through the Suez Canal or 44 days around Africa.

This is leading to a big increase of ships in transit as they take longer to make deliveris and make their ballast leg back to the US for another shipment:
 

3 2

Source: Oeystein Kalleklev, CEO of Flex LNG

All this is happening at a time when the US is producing natural gas liquids (including butane and propane) at a record pace.

The propane market has struggled this year because inventories are high and demand in the US is soft.  Propane stocks in the United States are at record levels.

In fact, the only thing holding up the propane market are exports, which have soared as China brings on new propane dehydrogenation (PDH) plants.  Global seaborne LPG exports increased 3.1% YoY while US exports increased 13% YoY.
 

4

Source: Dorian LPG November Investor Presentation

If problems at the canal persist, we are moving toward a glut of LPGs on the water.  Which should drive demand for LPG carriers sky high.
 

THE TRICKLE-DOWN EFFECT

 
The immediate beneficiaries of this are the earnings of the biggest LPG carrier companies.  Dorian LPG (LPG – NYSE), which owns 25 very-large-gas-carriers (VLGCs) that ship propane and butane along trans-atlantic routes, has seen its stock soar three-fold this year.  Jefferies recently raised Dorian’s 2024 earnings estimate up from $3.68 to $8.67 – an increase of 135%!!
 

5

Source: Stockcharts.com

Stealthgas operates smaller LPG vessels.  While Dorian LPG has a fleet of twenty-five 84,000 CBM ships, the biggest ship that Stealthgas has is only 40,000 CBM – and these are new builds that will be delivered in Q1 2024. 

The rest of the Stealthgas fleet consists of smaller vessels, the largest of which are four 22,000 CBM vessels (these do run global routes).  They own 23 vessels of less than 11,000 CBM.

Nevertheless, Stealthgas still benefits from the rising tide.  We’ve seen charter rates for smaller LPG carriers steadily move up for 4 quarters in a row:
 

6

Source: Stealthgas Q3 Investor Presentation

Stealthgas does not operate many of their vessels on the spot market.  In Q3 they had only 2 ships on spot.  Both were in JV’s with 50% ownership.  The rest of the fleet is on charter.


A LACK OF DISCLOSURE

 
You would think that Stealthgas would still benefit – by signing lucrative charter terms.   And they may be doing just that.  Unfortunately, we can’t be sure.

Stealthgas signed on to 9 new charters in the third quarter.  A few of these extended out as far as 2027.


7

Source: Stealthgas Q3 Investor Presentation

But we don’t know the terms of any of these charters.  Stealthgas isn’t super upfront with giving specifics.  Nowhere in their Q3 results do they tell us what their charter rates are.

Which brings us to the fly in the ointment…


FOOL ME ONCE?


Here is the BIG QUESTION with Stealthgas.  Is management on our side?
 
In 2021, Stealthgas spun-off its clean tanker assets into a separate company called Imperial Petroleum (IMPP – NASDAQ).  Here is what happened to Imperial’s stock after the spin-off.  
 

8

Source: Stockcharts.com

Over this same period tanker stocks like Ardmore Shipping (ASC – NYSE) and Scorpio Tankers (STNG – NYSE) did very well.   This isn’t a sector issue.

Instead, the problem with Imperial was dilution.  Imperial’s management was relentless in diluting the stock while giving no regard to the impact on existing shareholders.  Outstanding shares of Imperial increased 4,000% over the last 2 years!

The CEO who undertook this reckless dilution?  Harry Vafias, the same one that is CEO of StealthGas.  Vafias used the proceeds from share sales to grow the business and buy more vessels.   Many of which were bought from other Harry Vafias-run companies.

Yikes!

On the second quarter call we got a hint of the shareholder ire with this exchange:
 

9

Source: Alpha-Sense Transcripts

Usually this would be enough for a hard NO.   What complicates things here is that StealthGas IS NOT following the same path.

Stealthgas is not diluting shareholders right now.  In fact just the opposite: they are buying back shares.  

Stealthgas has bought back $19 million worth of their shares since announcing a share buyback in May.  They added to the buyback by authorizing an additional $10 million more.

They have also been reducing debt.   total liabilities have been reduced since the beginning of the year by $156 million, from $303.6 million, down to $147.5 million. As a result of the solid results being reported, shareholders’ equity has increased by $33 million to $550 million.  Net debt has dropped significantly.
 

10

Source: Stealthgas Q3 Investor Presentation

Nor is there a sign that Stealthgas will grow at all costs.  Stealthgas has been a seller of their older, smaller vessels.  They have been replacing them with larger, new builds.  They sold two vessels in July and announced another two sales that will close in Q1 2024.  They are buying to large 40,000 cbm vessels that will be delivered in Q1 2024.

The two new-builds will add $70 million of debt when they are delivered.

Imperial Petroleum has even changed their course and is now buying back shares.   Does that mean Vafias has found religion?  Maybe, maybe not, but in the case of Stealthgas he has a stake at the same table as the rest of us.  Vafias is the largest common shareholder through his investment company, Flawless Management (I am not making this up), which holds 7.1 million shares of the stock.
 

MORE UPSIDE TO COME?

 
Shipping stocks should generally be traded, not owned. There is hardly a better example of this than Stealthgas.  It’s as cyclical as the rest of the energy industry, and very prone to over-building their fleet.

Even though Stealthgas seems to be doing all the right things, I would suggest investors have to remain vigilant.  Shipping companies are a graveyard for investors and the management of Stealthgas hasn’t been a model for preserving shareholder value in the past.

The situation with the Panama Canal could improve in an instant – a torrential rain over the country (remember the California drought and what happened there) and the issue could quickly reverse.  Clarkson recently said that current VLGC rates of ~$138,000 were $100,000 more than they would be without the Panama drought.

On the other hand, if no rain falls this is only going to get worse.  When asked what might happen with the canal if the drought carries on and whether we may see VLGCs restricted entirely, Dorian CEO John Hadjipateras replied “it is impossible for us to know”.

What I do know is that if rain does not fall rates will rise.   Stealthgas should benefit.  For the remainder of the year 2023, Stealthgas has about 85% of fleet days secured under period contracts, but for 2024 only about 50% of their volume is priced.

Stealthgas has 3 vessels coming off charter in November, another 4 in December and 4 more in the first quarter of 2024.  There are also 2 JV vessels on the spot market and 2 more than come off charter in December.

This all means that the stock should move higher with rates. 

But with the big, BIG caveat that this only happens if the management team continues to make shareholder friendly decisions.  A sudden announcement of an ATM, a filing of an S-3, or a buying spree of new-build commitments and Stealthgas will go south and fast.

If that doesn’t happen and Vafias is content to win along with the rest of us, there could still be a lot of upside in the stock.   But Stealthgas is not for the faint of heart.  Or for anyone slow on the sell button.

HOW TO COVER YOUR BETS ON FALLING INTEREST RATES

0


My colleague Nathan Weiss and I have launched  InTheMoney, a service focused on helping retail investors learn and profit from low-risk options strategies. You can visit us at Inthemoney.capital.

So many investors buy low-priced, high-risk options.  We specialize in selling covered options. This approach targets a steady, low-risk return of 1-2% monthly, potentially yielding over 20% annually.

All of our monthly trades will be concentrating on 12-15 highly liquid, mid to large-cap U.S. stocks which Nathan and I know incredibly well. We issue trade updates monthly on our single best idea for the coming month – what we like to call ‘your best option.’  Most of the trades are 1 month long, but several could be 2-3 months.

Sometimes we see opportunities for 3-5% monthly returns, but our primary focus remains on consistent, low-risk gains. We’ll introduce these higher yield trades to our subscribers as “extras”, that complement our core low-risk strategy.

Our website features a concise, one-page format with a strong visual component, making it easy to grasp and apply our trading methods. This design ensures that even those new to options trading can quickly understand and apply our insights.

For a limited time, we’re offering our trade insights for free. In early 2024, we’ll transition to a subscription service priced at an affordable $179 per year. Subscribers can expect a thoroughly researched trade suggestion each month, following the options expiry (the third Friday of each month).

We think this strategy gives a low -risk way to earn extra income that can really add up over the course of a year.

Our idea this week is TLT-NYSE, iShares 20+ Year Treasury Bond ETF .

US Treasuries are really interesting here – this week’s zero reading on the CPI has helped investors come to the view the Fed is not only done raising rates, but futures now price in a cut by May 2024.  We don’t agree with that view – we believe rates will remain ‘higher for longer’ unless the economy really falters, but if investors are willing to position themselves this way Treasury yields have a long way to fall.

The risk/reward of the In The Money November TLT trade is really interesting given TLT shares could actually fall to $85.00 and the covered call trade will still earn the maximum return of 1.46% by December 15th and the breakeven is all the way down at $83.72, including a $.29 dividend to be announced on December 1st.

Anyone with a long-term time horizon (one year), or more negative on economic growth than I am (I expect ~2.1% Real GDP growth in the fourth quarter) should consider owning treasuries (or TLT shares) outright, or maybe writing covered calls using December 15th $90.00 calls for $1.71, giving TLT shares a little room to run and setting up for a $2.61 potential return (2.92%) if TLT closes at $90 or higher on December 15th.

Click Here to read this story on our website if you choose

123

Please sign up to receive our next few trade ideas for FREE — at inthemoney.capital or forward this to admin@oilandgas-investments.com and we will put you on the list.

Oil Market–Tightness vs Strength There’s A Difference

0

Oil bears? Anyone?

Maybe it’s just my feed, but the energy around energy on Twitter (excuse me, “X”) is as bulled up as I’ve seen since, well, the last oil run.

Of course, that run was all about “the war”, whereas this run is all about supply.

The lack there of.

Just last week we had J.P Morgan come out with the obligatory sell side piece titled: “Super Cycle Returns”.  Their case is all about supply, and the problems ahead.

J.P Morgan believes that there is upside for $150/bbl WTI over the medium term.  Their reasoning is 3-fold:

  1. Higher for longer rates driving up cost of funding for new projects.
  2. Companies returning cash to shareholders instead of investing in the ground.
  3. Peak demand and government policy discouraging investment.

These points all have a common theme: less investment leading to less supply.  Higher rates, reluctant boards and unfavorable macro will all contribute.

It is hard to argue with any of the points.  But all of these points were true when oil was languishing at $65/bbl back in June.

I am long oil (in a small way) but after such a big move in crude over a very short time, I feel the need to look at the other side.   We’re all bulled up.  A super-cycle beckons.  What is the bear case?

KEEP ON DRIVING

To me, the single, best summary of the bear case comes (unintentionally) from a tweet from Giovanni Staunovo (@staunovo on X).  Giovanni is a great follow on X for anyone looking for oil market information.  In the tweet below he’s not saying anything bearish, just giving us a chart that states the facts:

1

Source: X.com

When I look at this chart of US gasoline demand I’ll tell you what I don’t see.   Growth.

Forget the last data-point (there is some debate whether its accurate and may still be revised up).  Instead, look at the trend.  In the first 8 months of 2023 we are still below 2019 levels, still below 2021 levels, and barely treading water with 2022.

But the US economy isn’t just strong, it’s on steroids.  We just heard that from Fed Chairman Jay Powell last week.   US GDP was 2% in Q1, 2.2% in Q2 and Q3 looks like it could be a barn-burner – with estimates of between 3% and 5%!

A walk around your local mall or a dinner out is all you need to see that the streets are bustling and people are spending.  There is no recession in sight.

Yet the US still can’t break out to new highs on gasoline demand.  Now of course, the US isn’t ALL of global demand, but I’ll touch on the international side in a minute.

THE CRACK BETWEEN THE SPREADS

There is a hint of this divergence in the crack spreads.  Crack spreads are what refiners pay for turning oil into gasoline, diesel, and jet fuel.  Spreads soared in late August and early September, taking most of the refining complex with it.  The crack spread got has high at $40/bbl.

But those spreads have come back down to earth.

2

Source: RBN Energy

But that’s not the real story.  The story here has to do with the details.

Distillate (mainly diesel) spreads remain extremely healthy – about $46/bbl. Distillate=business.

3

Source: Bank of America Global Research

Gasoline spreads?  Gasoline=consumer. Not so good.

4

Source: Bank of America Global Research

Gasoline spreads have dropped precipitously as the summer driving season waned.  While some seasonality is expected, what we are seeing here is far more pronounced.

Is this because we are awash in gasoline?  Well, no.  Actually, the opposite.  Gasoline inventory is bouncing along the bottom of its 5-year range.

5

Source: Bank of America Global Research

What gives?  If you have low supply, how come we have low prices?

Look, I don’t know what the market is telling us – or even if it is telling us anything at all.  Maybe we are just seeing extreme seasonality.

What I do wonder is–maybe inventories don’t matter as much as they used to–because the trend in US demand is down.

We are so accustomed to growing oil product demand.  Every year (when there isn’t a recession) demand goes up.

We are dialed into expecting inventories to trend toward the high end of the 5-year average.  You always need more inventory than in the past because demand is always higher.

What if that isn’t the case anymore?   It would be okay to bounce along the bottom of gasoline inventories because next year demand is going to be a little bit less.  The year after – less again.

“EMERGING” UNSCATHED

The bear case for oil is the developed world; OECD demand.  The bull case is emerging markets; non-OECD.

Back to the super-cycle.  The second leg of the J.P Morgan forecast is an expectation of an increase in oil demand of 5.5 million bbl/d by 2030.  That works out to about 0.8mmbbl/per year of growth.

This is a lot less growth than we have seen in the past.  But it is still growth.  With supply looking tipsy, that may be all you need for higher prices.

Where is that growth going to come from?  Rather risky emerging markets.

6

Source: J.P Morgan

Emerging markets will account for roughly 2x overall demand growth from 2023-2030 because OECD demand will be falling.

Unfortunately, I have not found a detailed breakdown of that demand growth.  What you can see from the report is that two countries, China and India, are expected to account for 65% of demand growth.

That makes sense and gives us some comfort in the forecast.  This is another one of those China and India stories—Asian industrialization has been happening for 40 years.  We are all familiar with that.

A closer look though leads to some questions.

The contribution from China and India is heavily weighted to 2023 and 2024.   In fact, most of the growth from 2025-2030 is from “other non-OECD” countries.

This is demand from the Middle East, from Asia-ex China (Thailand, Vietnam, Indonesia), from Latin America and from Africa.

That is a story I am less familiar with.

I’m not saying that won’t happen.  But relying on these emerging markets for the intermediate term bull-case is not without risk.

DIESEL KEEPS BURNING

Look, I am trying to point out the bearish factors that are out there.  But I’m not saying that I’m an oil bear.

While gasoline demand and gasoline crack spreads are hinting that some weakness is happening, diesel is roaring ahead.

Also, while the Chinese economy has not strengthened as everyone had hoped, oil demand continues to grow.

7

Source: Morgan Stanley

OPEC’s latest estimates for global 2023 oil demand were revised up slightly month-over-month.

8

Source: OPEC September 2023 Monthly Oil Market Report

OPEC’s own supply/demand balance is forecasting a 2.25 mmbbl/d increase in demand in 2024.

9

Source: OPEC September 2023 Monthly Oil Market Report

This, while at the same time the cartel enforces reduced production levels and pays lip-service to their worries about demand!

HOPING FOR DISAPPOINTMENT

Which brings us to the last consideration: none of the demand concerns matter if supply disappoints us enough.

OPEC+ is focused on price.  Gone are the days where Saudi Arabia “enforced discipline” on the cartel and flooded the market with oil.

Instead, Saudi Arabia seems acutely aware that the good old days are numbered.  They need to make hay while they can.

It is all about supply management.  Keeping prices high enough for a windfall but low enough to keep demand strong.  This is really a bull market in supply management more than oil demand.

OPEC is helped by the shale struggles.

The EIA recently forecast that shale output may decline again in October – the third month in a row.  The US rig count is rolling over again.  And the global economy is proving far more resilient—so far—than anyone might have thought.

10

Source: BofA Global Markets

It is easy to forget how helpful low interest rates were for shale in the late 2010’s.  Now interest rates are a headwind to more drilling.

Maybe this dearth of supply that is enough to drive prices higher.  A supply-side squeeze super-cycle?

Maybe.  Just don’t forget that you still need demand.  After all, it is demand that drives the bus.

Each Bear Market Seeds A New Bull Market It Just Needs A Little Sunlight to Grow

0

Solar stocks have taken a beating this year.

The Invesco Solar ETF (TAN – NYSE) is down over 35% from its peak.

1 2

Source: Stockcharts.com

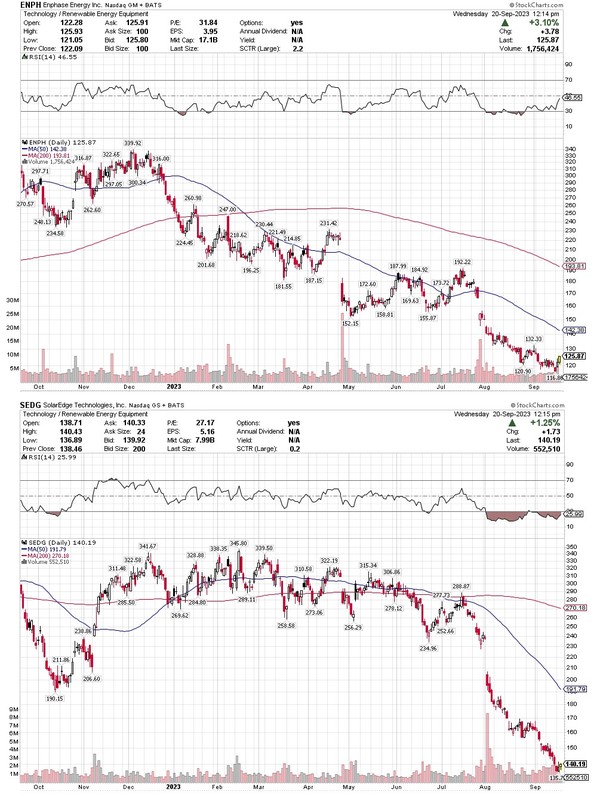
Some of the worst performers have been former market darlings like Enphase (ENPH – NASDAQ) and SolarEdge (SEDG – NASDAQ).

Both sit at 52-week lows.  Enphase is down 60% since the beginning of 2023.  SolarEdge is down nearly 50% in the last month alone!

Looking at these charts you’d conclude that the whole solar business is taking it on the chin.  But a closer look reveals the move has had both winners and losers.

Outperforming this year have been stocks like Array Technologies (ARRY – NASDAQ) and NexTracker (NXT – NASDAQ), both of which are up significantly from their spring lows.

2 2

Source: Stockcharts.com

What is the cause of such divergence?

Start with hedge funds.  The hedgies haven’t exited solar stocks entirely.  Instead, they have taken preference of some over others – in particular favoring those exposed to utility scale solar while shunning those that serve the residential solar market.  Some funds are almost certainly going long-short between the two.

3 2

Source: Bank of America Global Research

Hedge funds love Array Technologies and NexTracker, another utility solar play.  Most unloved are the laggards: Enphase and SolarEdge – which just happen to be the names most geared to residential solar installations.

BIG SOLAR UTILITY

The hedge fund preference hints at the market trend.  Utility solar remains strong while residential demand is slow with inventories swelling.

The slowdown in residential solar installs has happened in both the US and Europe.

In the US, residential solar growth has come to a halt due to rising interest rates, lower natural gas prices and California’s NEM 3.0 (NEM stands for net meter monitoring) legislation, which reduced the electricity export price paid to rooftop solar customers–by as much as 75%!!!

In Europe the picture is brighter, with underlying demand growth of 30-40% – but it was expected to be even better.

In Europe, energy shortages led to high prices last winter, which led to a big build in solar module inventory–everyone was expecting customers would flock to solar–maybe a big (60%+) growth year was coming.

When power prices backed off, European solar distributors were left holding the bag full of channel inventories far higher than normal.

With demand weak across the world, does this all mean that solar is dead?

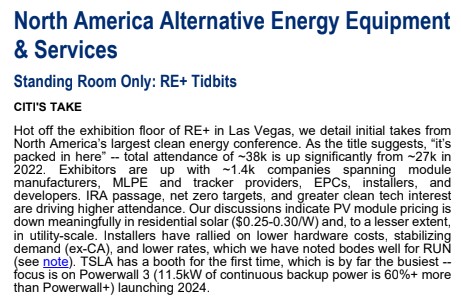
More likely on pause.  Just this week Citigroup described the exhibition floor in Las Vegas at North America’s largest clean energy conference as “standing room only”.

4 2

Source: Citigroup Research

The question of solar stocks bottoming is “when” not “if”.  But finding that bottom has proven extremely painful for investors.

WHEN WILL IT BOTTOM?

SolarEdge CFO Ronen Faier gave a sober assessment at an investor conference recently: we’re not there yet.

Faier said that Europe’s Q3 and Q4 would continue to be weak.  Europe’s inventory problems are being exaggerated by cash flow issues from distributors.  Distributors are delaying orders, even those “that they will need in Q4″ because of their cash crunch.

But this will pass.  By the end of Q4 or at latest Q1 next year Faier believes European inventory will stabilize – with as little as a month on hand.

Meanwhile the underlying market continues to grow at 30% to 40%.  That means the pickup could come quick – as growth asserts itself and distributors expand inventory-days once their cash crunch eases.  This dynamic applies to both inverters and batteries.

In the United States the picture is muddier.  Faier was blunt, saying that “underlying demand is not growing this year”, that it is “maybe even declining” and that the trend could continue into 2024.

That view is also held by Wells Fargo.  Wells expects a 13% decline in residential solar demand in 2024.  The reasons?

  1. Natural gas prices
  2. California NEM 3.0
  3. Interest rates.

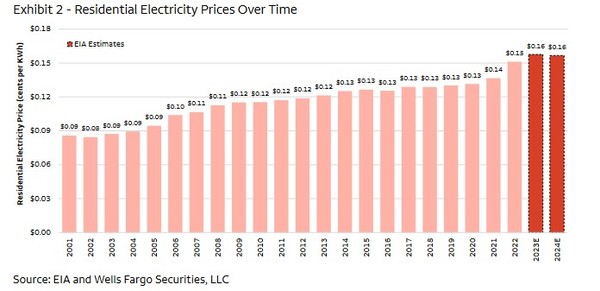
The EIA is forecasting a decline in US electricity prices in the US in 2024 due to lower natural gas prices.

This would be the first decline since 2018.  While their forecast price decline is modest – only 1% – residential solar has had a big tailwind for the last 5-years as energy costs have done nothing but go up.

5 2

Source: Wells Fargo

A second headwind comes from California’s new NEM 3.0 legislation, which was put into place April 15th, 2023.  California has been the biggest market for residential solar.

The changes enacted by the California Public Utilities Commission, significantly cut export rates for extra electricity generated by new installations.

NEM 3.0 slashed California’s export rate by about 75% – from a current average of around 30c/kWh to as low as 5c/kWh depending on the time of day.

The result has been a big decline in demand.  Permits for new installations have been declining since the change took effect.  Wells Fargo believes September permits will be down 23% YoY and that the number could increase to -40% YoY by November.

But there is a silver lining.  While California has lowered the average rate paid for solar produced, that rate varies with time of day.  During peak demand times (in the evening) the rate paid increases substantially – to the same level it was in the past.

This strengthens the case for storage.   Enphase is already on it, introducing a new next-gen battery product specifically designed to deliver power into a NEM 3.0 environment.

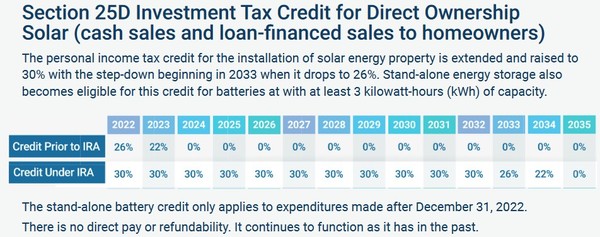
Also helping the case for storage, both in California and elsewhere in the US, is the Inflation Reduction Act (IRA).   The IRA extends already existing credits for residential solar to include stand-alone storage.

6 2

Source: Solar Energy Industries Association

The other positive (well sort of) is that YoY comps can only last a year!

Wells Fargo believes that once we get past April, the numbers will improve.  In addition to easy comps they expect California installers to figure out how to sell into the new environment.  Wells sees permitting “improving significantly” beginning in April, with recovery to pre-NEM 3.0 levels by October 2024.

For the rest of the US, the final headwind to demand has been rising interest rates.  When and if interest rates decline is anybody’s guess.  What I will say here is that even stabilizing interest rates should help demand.

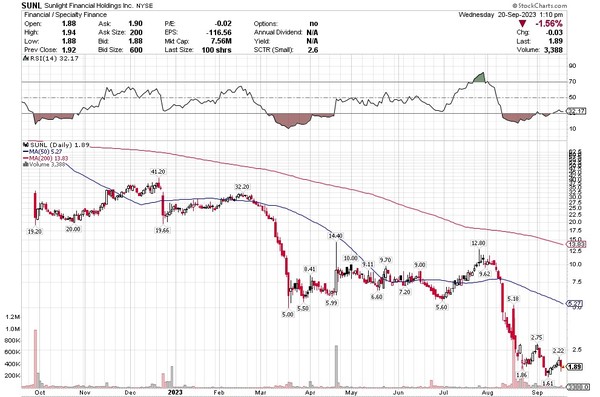
I wrote about Sunlight Financial (SUNL – NASDAQ) in a blog post a few months ago.  Sunlight is a very beleaguered solar financing company.  They provide credit to homeowners installing residential solar.

Sunlight’s #1 problem has been interest rates.  Not so much the level of interest rates, but the rise of interest rates.

What do I mean?  Sunlight: A. makes loans to homeowners for solar, and B. packages them up into securities and then sells those securities off to investors.

A look at Sunlight’s stock price is all you need to see how that has gone.

7 3

Source: Stockcharts.com

Sunlight got into trouble as rates rose through 2022 and then spreads widened in 2023.   Loans they made a few months before were suddenly worth less because of higher rates.  Sunlight was left holding the bag on loans that they couldn’t sell without taking a haircut.

While it may be too late for Sunlight, it would help lenders like Sunlight a lot if rates and spreads just did nothing for an extended period of time.

UTILITY SOLAR DOESN’T BLINK

The argument that it is the pace of change in interest rates and not the level of rates that matters most is supported by the utility solar market.

While residential solar growth has hit a snag, the utility solar market has kept trucking along.

Morgan Stanley put out a note just this week where they said “developers and EPCs nearly unanimously conveyed a sense of unwavering conviction… for utility scale solar”.

Why is utility solar continuing to fare so well?   Because these larger players still have access to capital and solar is still the cheapest new capacity around.

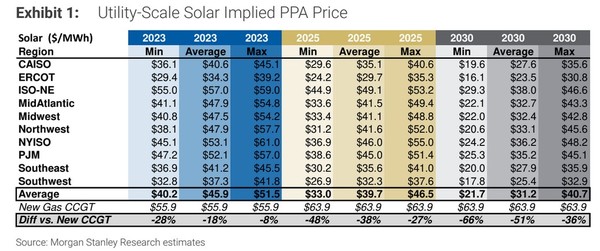
Power price agreement pricing for new utility solar is significantly better than what is needed to build a new gas co-gen plant.

8 2

Source: Morgan Stanley

FALLING PRICES

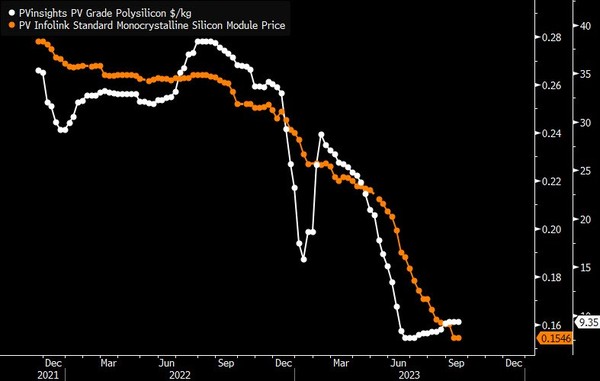
Solar install demand and polysilicon pricing have fallen dramatically. Citi pointed out that their discussions with solar module manufacturers indicate that “residential module pricing is down ~50% Y/Y with pricing in the $0.25-0.30/W range for ~370-420W panels.”

Now that’s liquidation!  See this chart of polysilicon pricing, which is down 75% in the last 12 months.

9 2

Source: Bloomberg

You can look at it two ways.  Either “oh my God the sky is falling” or “this is bound to spur more demand”.

Falling module pricing make solar more attractive.  That will set the base for a recovery.  Each bear market is the seed for the next bull run.

Much of the same could be said for the stocks of Enphase and SolarEdge, which have charts that are pretty similar to the module and polysilicon pricing charts above.

10 2

Source: Stockcharts.com

Neither of these stocks has ever been “cheap”.  But after the recent swansong they are getting close.

11 2

Source: Sentieo

Both stocks now trade at multiples below the market average.  In the case of SolarEdge, significantly below.

That doesn’t mean that they can’t get cheaper.  And the solar market has not bottomed just yet.  But it is likely getting close.  A bottom in Q1 2024 seems more likely than not.

If the typical performance of these stocks holds true, they should bottom ahead of that.  Which could be any day – if you can handle the pain.

The “Switch” Behind a Nearly 4X Stock Surge (Since March)

0


Pioneer Power Solutions has seen its stock nearly quadruple since March, and investors can be forgiven if they think it’s because of their sexy, mobile EV-charging products.
 

1


Source: Stockcharts.com

The stock went ballistic the day the company announced huge Q4 2022 financials—revenue up 172% to $9.5 million, with higher margins YoY.  Most importantly—they reported real profits!

In Q4 22 Pioneer had 10c EPS.  In Q1 EPS remained positive at 1c per share.  CEO Nathan Mazurek telegraphed that Q1 would likely be the weakest quarter for the year.

Pioneer is guiding to revenue of $42 million to $45 million for the full year 2023.  At the midpoint that is 61% year-over-year growth.

The US small cap broker HC Wainwright is forecasting 42c EPS for 2024.  That puts the stock at about 20x earnings.

But the catch here is—their EV product is still REALLY small, and not contributing to the profit story here.

Management has been talking up their new mobile EV charging products, called E-Boost, since mid-2021. 

Could this stock now be something that The Market has searched for—an EV charging company that’s growing AND showing profits?  Isn’t that a Holy Grail for investors?

There definitely is real growth here—but as yet, not so much from EV demand.
 

2


Source: Pioneer Power Solutions Financial Statement

Look I get it–electrification / de-carbonisation is probably The Biggest Meme in the investing world right now—from carbon credits to Electric Vehicles to solar power—the scale of this, and the runway (years!) attracts a lot of interest.

And for the last 18 months, Pioneer has been issuing a lot of press releases on their EV charging products.

But as investors got excited about PPSI–other EV charging stories like Blink Charging (BLNK-NASD) and ChargePoint (CHPT-NASD) have been mired close to their 52-week lows. This is CHPT’s chart:
 

3


In Q1 23, Blink took an operating loss of over $30 million.  CHPT had an operating loss of almost $90 million. Both of these companies have gross margins in the low 20%’s.  Their operating expenses are as large as their gross revenue.

Maybe Pioneer is somehow different?  Well, yes and no.  They do have an interesting niche in mobile EV charging—and it is growing. 

You see, Pioneer is a two-product story, with their EV charging solution, called the e-Boost, being one of them.

e-Boost is a “mobile, self-contained EV charger” fueled by propane.

4


Source: Pioneer Power Solutions Investor Presentation

The key word here is mobile.  These are chargers intended to be used where renewable power sources are not available. And this is a very valid business model—with growth coming in several different niche verticals.

Pioneer launched e-Boost in the first half of 2021.  In Q1 22, they received their first orders.  At the Planet Microcap Showcase in April, CEO Nathan Mazurek said that they had between $1.5 million to $2 million worth of E-Boost units in 2022.

Those orders have continued to come in this year. 

  1. After announcing orders in January for two skid mounted and two trailer mounted units and
  2. then another order in April for a trailer unit purchased by a “major transportation agency”,
  3. Pioneer followed up with a June press release announcing “multiple units” ordered by a “major global automaker”
  4. and a July press release summarizing “several new customers” totalling orders of $6.2 million in the second quarter.

e-Boost seems to be gaining momentum.

Pioneer is expecting e-Boost to contribute to revenue in the second half.  CEO Nathan Mazurek said he is “shooting for $3-$5 million in revenue for 2023” and contribute between 10 to 20% of total revenue during the fiscal 2024.

So where is all this growth and profitability coming from?


SWITCHING GEARS HERE–
HAVE YOU HEARD OF WALMART?


Most of Pioneer’s revenue today comes from an offshoot of their legacy transmission and distribution business.  And this business does have some potentially HUGE growth in it, from some very big customers.

That business sells switchgears. What is a switchgear? 

You aren’t the only one.  I had to figure that out myself.

Think of a switchgear as a power control system.  It regulates power coming from the utility, it prevents surges, isolates it from damage and, if attached to battery solution, switches between primary and second power sources.

That service is becoming MUCH more important in the US, as both winter storms and summer heat stress the electrical grid.  And PPSI’s product suite has a bit of a unique twist in this market too.
 

5


Source: Industrial Electric Manufacturing

Physically a switchgear is a box full of switches, fuses, relays circuit breakers and wiring.

Switchgears are not anything new.  Lots of industrial and commercial buildings use switchgears. 

Any business that consumes a lot of power may use a switchgear to manage that power.  Datacenters, shopping malls, office building all may use switchgears.

And hey, switchgears are also an important part of EV charging.  They sit between the transformer and the charger, regulating current and protecting against surges.
 

6 2


Most switchgears are largely commodity products.  There are a ton of companies that make switchgears:
 

7 3


Like I said,. Pioneer’s switchgear product, called E-Bloc, has a bit different spin.
 

8 2


Source: Pioneer Investor Presentation

The E-Bloc is tailor made for the emerging renewable power grid.

E-Bloc is designed to manage complex (read: multiple) power sources.

As CEO Nathan Mazurek described it, “if you’re just a shopping mall or an office building and you’re getting your feed 100% from [a single power source] we have nothing to offer.”  Where Pioneer does have something to offer is if you are a large power consumer that relies on multiple power sources.

That could be a solar installation onsite, a back-up generator, or a battery storage backup.

The E-Bloc is not cheap.  Depending on the size, Pioneer sells them for between $125k and $250k a pop. 

Their customers come from a wide range of industries, from manufacturing businesses to big box stores to utilities.

9 2


Source: Pioneer Investor Presentation

These customers tend to be large, warehouse style building that consume a lot of power, can’t tolerate downtime to the grid and are looking for a solution that can incorporate multiple power sources.


E-BLOC’S BIG CUSTOMER–UNVEILED


Pioneer has had one primary customer that has driven E-Bloc sales over the last few years.

In 2022, Enchanted Rock Electric was 45% of Pioneer’s sales for the full year.
 

10 3


Source: Pioneer 10-K

That number increased as the year went on.  In Q4 2022, Enchanted Rock accounted for 75% of Pioneer’s sales.  In Q1 2023 Enchanted Rock made up 73% of revenue. 

Who is Enchanted Rock?  They are a provider of dual purpose microgrids.  These are essentially power solutions that provide redundancy – often through natural gas generated back-up power.  To manage their multiple power sources, they use e-Bloc.
 

e


Source: Enchanted Rock Website

Going through Enchanted Rock’s blog and press releases, you quickly notice the overlap with Pioneer’s contracts.

For example, Enchanted Rock talks here about the RNG microgrid they built for Microsoft.   Microsoft appears to be the large data center customer that Pioneer has talked about. 

One of the first adopters of E-Bloc that Pioneer talked about was a large Texas Supermarket chain. 

The timing overlap suggests that this was another Enchanted Rock customer, the grocery chain H-E-B.

Enchanted Rock has had one particularly large customer.  They talk about that customer, a “National Superstore Retailer”, (though left unnamed) here.   But if you dig enough into articles about the project that Enchanted Rock completed, you learn that the customer was Walmart.

Enchanted Rock sold 60 microgrid ATS units to Walmart.

Those are almost certainly the same 62 store E-Bloc orders that Pioneer announced.
 

11 2


Source: Pioneer Investor Presentation

Mazurek talked about these orders at the Sidoti conference last year:

“The end of December of ’21, we announced our largest order to date from one particular retailer with a targeted 62 stores to go completely to the system. And again, just one retailer is actually planning on taking up to 500 of their 5,000 stores over the next couple of years and developing new and even edgier technology and product with us for the balance of their stores as that continues to develop.

BUT…so far, those additional stores haven’t materialized.  From the Q1 2023 call:

The initial order we announced was for 63 stores, all of which we’ve delivered.  Internally they have released to me that they have designated 1,000 stores for this program.  400 to 500 or so in a more immediate way. 

Our backlog right now reflects 0 additional stores, they haven’t come out with any yet.”


If and when Walmart does come back to order more, it could be huge.

Is it a risk that Enchanted Rock makes up so much of Pioneer’s business?  Well, it certainly makes Pioneer dependent on Enchanted Rock’s success.   But that goes both ways – if Walmart comes back for more orders, it is not necessarily a bad thing.

Mazurek believes that Enchanted Rock will become a smaller part of their business this year and next, before coming back with a vengeance in 2025. 

I took that to mean that to mean that future orders from Walmart may still be some time off.


CONCLUSION:
INVESTORS ARE BUYING THE STEAK
NOT THE SIZZLE


I’m glad I researched this—because the sizzle (EV charging via E-Boost) is different than the steak (E-Bloc / microgrid resiliency).  But both can be growth drivers over time.  For now however, I am not long, but the stock is on my radar.

For now, it is Enchanted Rock and their E-Bloc orders that have driven Pioneer’s revenue growth.

Pioneer operates in two segments.  E-Bloc is part of the Transmission and Distribution (T&D) segment while E-Boost is part of the Critical Power Solutions (CPS) segment.

While both segments contribute to revenue, the largest contribution has come from T&D and E-Bloc.
 

12 2


Source: Pioneer Investor Presentation

e-Boost has not contributed meaningfully to revenue yet.  Mazurek clarified that there was no Q1 revenue booked from e-Boost and they expect “a little bit” in Q2.

The backlog is similarly weighted to E-Bloc and T&D.  
 

13


Source: Pioneer Q1 10-Q

CPS backlog is growing.  But not all that CPS backlog comes from e-Boost.  The CPS segment also includes service revenue contracts for their engine generator services business.  In an interview we did with Mazurek, he said that most of the CPS backlog growth is from E-Boost.

But for the next couple years at least, this story will be all about E-Bloc.


Keith Schaefer

P.S. “Hidden gems” — great companies with major upside — aren’t easy to find.  But I’ve discovered one, and it’s now one of my highest-conviction trades in the Whisperer portfolio. Follow this link to learn more about this company, and how to get my full write-up on it — That’s 18 pages of my just-released research. Click here for details.

SOLAR ENERGY PAYS FOR INVESTORS…..This Junior Solar Developer Just Landed A MEGA SALE $200M++ (all cash!)

0


I bought a lot of solar stocks back in January. I see solar as the big energy play of 2023, not hydrocarbons.
 
Junior solar developers are REALLY cheap–but not because of cash flow multiples. Multiples are much higher than oil & gas. But the take-out value of solar projects–because of their 25-40 year power contracts–is HUGE!
 
My largest position Westbridge Renewables (WEB-TSXv / WEGYF-OTC) proved that out this week.
 
This week management surprised shareholders by monetizing FIVE of its early-stage solar assets in southern Alberta, totalling 1.4 GW or 1400 MW for CAD$217 – $346 million. CASH. At the bottom of that range, it works out to roughly 15.5 cent per watt.
 
The Market had been expecting a sale of just ONE—its lead Georgetown asset. Alberta is a premium solar market not just for weather but also—it and Ontario are the only Canadian provinces to de-regulate power prices, and they are 3rd highest among the 10 provinces (see chart at bottom).
 
WEB location of solar farms

If you think that Westbridge has 100 M shares out, that’s a cash amount of $2.17 – $3.45 per share. Some of that could be a special dividend (the CEO Stefano Romanin owns 20 M shares) or internally fund growth–or BOTH!
 
This deal is announced but not closed.  The buyer is Greek conglomerate Mytilineos (OTC-MYTHY), a US$4 billion company. One of its main backers is Canadian Prem Watsa via Fairfax Financial (FFH-TSX; CAD$23 Billion market cap), a legendary investor.
 
I have TWO OTHER JUNIOR SOLAR STOCKS that I am very keen on right now–to get their name and trading symbols for $5, click HERE.
 
The stock may not come to trade for a few days, as the Canadian exchange people wrap their heads around such a new, small company getting such a big big deal so quickly. Closing of the purchase and sale of each asset is conditional upon
  1. obtaining approval of the purchase and sale by Westbridge shareholders
  2.  and the TSX Venture Exchange,
  3. and obtaining regulatory approvals from the Alberta Utilities Commission (AUC).
Understand that the company will not receive much money initially. There was a small downpayment, but Mytilineos won’t be paying for these assets until they hit NTP and get into production. 
 
Georgetown, their lead project has NTP–Notice-To-Proceed, which is a key milestone for production. Once an asset hits NTP–anywhere in North America–it is worth a lot of money.
 
SunnyNook likely will hit NTP later this year. As rough guidance, given that the first two assets could monetize this year, Westbridge could receive cash of just under $100 million this year and just over $100 million next year.
 
So there’s no big cash up front (so the stock will open higher but not close to $2 IMHO). But for sure WEB will never have to raise capital again if they don’t want to.
 
And they will now be able to be a BOOM company–Build Own Operate Maintain–and get all the long term cash flow from their next few solar projects–if that’s what they want to do. They can do so without ever raising capital again.
 
The final purchase price will be very complicated, as WEB has a trailer on the ITC credits that Canada is offering–which could total over $400 million.
 
I purchased my 100,000 shares in December at 57 cents. It closed Wednesday at $1.22—already a double, but it has a chance to double again.
 
WEB 1 yr chart Jun 1 23

 
WEB Mytilinios snapshot

It’s going to cost Mytilineos about CAD$1.7 B-B-B-billion to build these power plants, and they expect to have them all operating by 2027.
 
This deal was done with no commission to anyone. No M&A fees, no big lawyer bills. This team–Stefano Romanin and Scott Kelly–raised all their own money.  There was never any analyst coverage here by the sell side because they were never going to raise any money/make fees.
 
There is a good story on Mytilineos (and the Westbridge deal) in Canada’s Globe and Mail newspaper today—you can read it here:
 
https://www.theglobeandmail.com/business/industry-news/energy-and-resources/article-canada-alberta-solar-farm-mytilineos/
 
The size of this deal I’m sure surprised everyone. But this transaction proves how much the industry is valuing these projects–WAY MORE than investors are. That’s the opportunity on my two other solar stocks–there is little competition for stock.
 
But this deal shows the Market is coming around. This is the way to play energy–and small caps. These two companies have proven teams who have already monetized solar assets. Both have less than 50 million shares out, and neither need funding this year.
 
Subscribe now and get these two picks for just $5– Click Here.

WE HAVE NEVER BEEN MORE RELIANT ON THE FED Belly-Up to the Fed Bar Boys!

0


Folks, a lot of the small banks in the US are–for now anyway—technically insolvent. 

That sounds scary.  And it could be.  But only maybe.  Because on the other hand the banks aren’t actually insolvent. Not in real life.  Most of them, any ways.  But The Street isn’t exactly sure which ones are and which ones are not.

That’s why the US banking index—symbol KRE-NYSE—has such a horrible chart.


1

 
Most banks are still going about their business – making loans, taking deposits.  In fact, most banks are still making a lot of money, just as their first quarter earnings showed.

As long as the banks collect on their loans, as long as there is no devastating recession, and maybe most important: as long as the banks can continue to hold their assets through to maturity and not be forced to sell, they will be just fine.

In other words, everything may work out.

Unless it doesn’t. 
 

BANKING MAKE BELIEVE


How can everything either be just fine or totally off the rails?  Talk about black and white!

Welcome to the world of banking.  It’s a true confidence game.

The difference between good and awful comes down to mark-to-market.

You might remember mark-to-market from its top billing in the Great Financial Crisis.  Back then it was the mark-to-market of mortgage loans that threatened the system.  Today it is…well, actually it is still largely the mark-to-market of mortgage loans.  But this time there are also other loans and securities as well.

Mark-to-market means just what it says: pricing the asset at what the market would pay for it TODAY (or whatever day it is).

We do this every day with our own portfolios.  We open our bank app and are greeted with the value of portfolio is at that minute.   That is mark-to-market.

But banks do not typically mark their assets to market—almost never with their loans and often not with their bonds.

Why?   Because banks have no intention of selling them.  Who cares what it is worth right now. 

It is literally the job of a bank to hold a loan until it comes due (with a few exceptions of course).

Most loans and securities on a banks balance sheet are priced at what they were made at, NOT at what the market would pay for them on any given day.


THE BIG, BAD FED

 
There’s really only one scenario where the mark-to-market value matters to a bank–if there is a sudden, massive change in interest rates that occurs over a very short period of time.

Which almost never happens—except last year, when it did!

When the US Federal Reserve raised interest rates it was not the most they have ever done, but it was probably the fastest since the 1970s.   And it was the first time they had raised them this fast from 0%, which had an outsized impact on the price of assets.

2

Source: St. Louis Fed Economic Data
 

KICKING THE CAN


The one thing that is on the side of the banks is time.

Every month that passes their loans and bonds get a little closer to coming due.  When a loan comes due, it will (God willing!) get paid back at par.  The bank that owns it is a little closer to being made whole.

The Fed knows this.  They are trying their best to kick the can down the road.

The Fed has now created a lending window that lets the banks park their underwater securities at par, while they wait for them to come due.

The Fed said that they would take any and all government and quasi-government bonds, stuff like Fannie Mae, Ginnie Mae securities, at par value, so even better.

What that means for the bank is–that they can take their $150 TLT-NYSE equivalent bond, give it to the Fed, and get $200 worth of credit.

It is effectively a way of artificially pumping reserves into banks.  Instead of holding an underwater bond they can hold cash – if they need it.  When you see/hear people talking about the $160 billion at The Fed Window and how it’s money printing–this is what they are talking about.

Is it money printing?  That might be a stretch.   But it certainly is giving the banks a lifeline when they really need one. 

Without this, I can almost guarantee the DOW/S&P charts would look a lot more like KRE than they do now.  Investors are completely reliant on The Fed right now for this.

One could argue that these big board index charts are pricing in almost NO systemic risk.  And to be fair, big banks are not in (near as much) trouble.


THE SCHWAB SCENARIO…


There are plenty of banks that are at the center of this storm but the stock that has held my curiosity the most has been Charles Schwab (SCHW – NASDAQ).

Schwab just seems like such a stalwart.  You’d expect Schwab to run into trouble about as much as you’d expect JP Morgan (JPM – NYSE) to run into trouble. 
Yet trouble it found.

Everybody says Schwab is unfairly sold down because they’re enjoying great account growth, they’re taking share, their earnings are up.

Yet the stock price keeps going down!

3

Source: Stockcharts.com

Schwab may not be as safe as everyone says.

If you tweak your numbers enough, make some assumptions about the haircut they would have to take on their assets if they absolutely had to sell them TOMORROW, you can imagine a distressed scenario where the company’s earnings would be..A LOT less.

We think of Schwab as a broker but Schwab is also a bank.  And banks need to maintain capital.  Schwab, like all banks has capital but some of that capital is underwater if it is marked-to-market.

Now if something went south and Schwab was in the place of having to sell assets they probably wouldn’t be able to – at least without raising more capital to offset the loss – by selling shares.

If Schwab did that, the dilution would lower EPS. 

Schwab is really the poster-boy for the entire banking system right now.  It is not about whether they are going to make it – Schwab is going to make it – it is more about what the earnings look like on the other side. 

Schwab made $6.6 billion last year, or $3.52 EPS.  With some not-so-heroic assumptions you could spitball $5 billion of forward earnings on a higher share count to get <$2.50 EPS.   Suddenly that $50 share price is 20x earnings and the stock isn’t looking “cheap” anymore.

What can be said for Schwab can be said for much of the system.


Two Possible Outcomes

 
In the first, we scoot on through with a version of Extend-and-Ignore.  Eventually the mark-to-market losses get amortized and marked toward maturity.

In the second, events happen that cause “a deleveraging event”. That means banks become forced sellers of assets.  If this happened and the Fed didn’t step in (I think they would), they would all be taking massive losses.

That’s why investors are now SO DEPENDENT ON THE FED.

This whole thing is like watching a kid chase a ball into the street as a car barrels ahead further down the block.  You don’t know how it ends.  

You think the driver of the car is probably going to see the kid, it is probably going to stop in time, or someone else could even jump out in the street and save the day.  In other words, there are a lot of things that could go right.

But there is one outlier scenario where things could go very, very wrong. 

The thing about banks is that the whole system can quickly become reflexive, self-reinforcing.   That can create a downward spiral. And that is the big risk.

There has been a big spike in downside volatility in the last few days. You know, something that anticipates the possibility of big down days.

A lot of this is going to depend on the Fed.  Not to overdo it.  More importantly – to take their foot off if it begins to look like that spiral is about to start.

I REALLY hope that they manage us through this.   If they do, this could be the start of the next bull market


Keith Schaefer