Solar stocks have taken a beating this year.
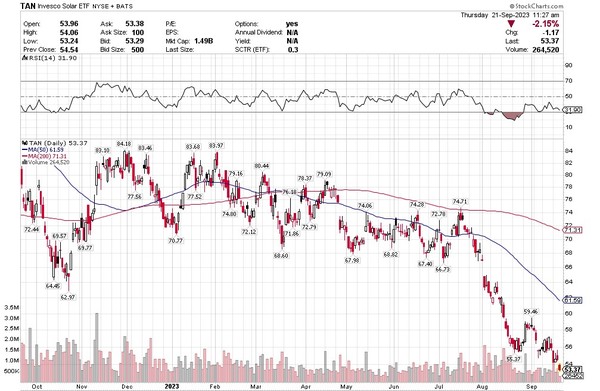
The Invesco Solar ETF (TAN – NYSE) is down over 35% from its peak.
Source: Stockcharts.com
Some of the worst performers have been former market darlings like Enphase (ENPH – NASDAQ) and SolarEdge (SEDG – NASDAQ).
Both sit at 52-week lows. Enphase is down 60% since the beginning of 2023. SolarEdge is down nearly 50% in the last month alone!
Looking at these charts you’d conclude that the whole solar business is taking it on the chin. But a closer look reveals the move has had both winners and losers.
Outperforming this year have been stocks like Array Technologies (ARRY – NASDAQ) and NexTracker (NXT – NASDAQ), both of which are up significantly from their spring lows.

Source: Stockcharts.com
What is the cause of such divergence?
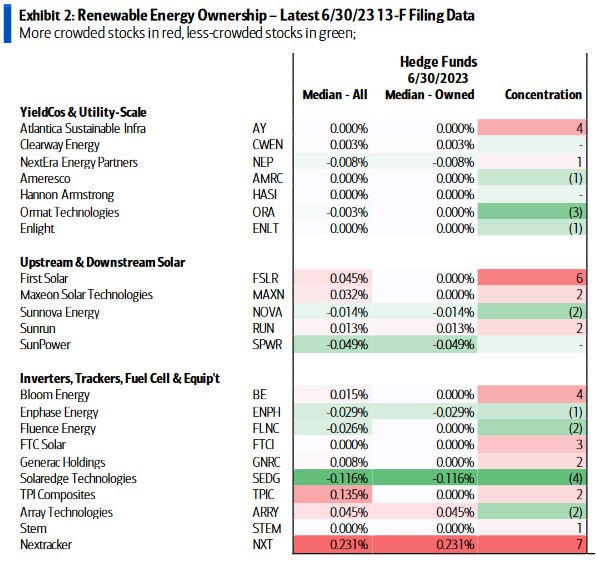
Start with hedge funds. The hedgies haven’t exited solar stocks entirely. Instead, they have taken preference of some over others – in particular favoring those exposed to utility scale solar while shunning those that serve the residential solar market. Some funds are almost certainly going long-short between the two.
Source: Bank of America Global Research
Hedge funds love Array Technologies and NexTracker, another utility solar play. Most unloved are the laggards: Enphase and SolarEdge – which just happen to be the names most geared to residential solar installations.
BIG SOLAR UTILITY
The hedge fund preference hints at the market trend. Utility solar remains strong while residential demand is slow with inventories swelling.
The slowdown in residential solar installs has happened in both the US and Europe.
In the US, residential solar growth has come to a halt due to rising interest rates, lower natural gas prices and California’s NEM 3.0 (NEM stands for net meter monitoring) legislation, which reduced the electricity export price paid to rooftop solar customers–by as much as 75%!!!
In Europe the picture is brighter, with underlying demand growth of 30-40% – but it was expected to be even better.
In Europe, energy shortages led to high prices last winter, which led to a big build in solar module inventory–everyone was expecting customers would flock to solar–maybe a big (60%+) growth year was coming.
When power prices backed off, European solar distributors were left holding the bag full of channel inventories far higher than normal.
With demand weak across the world, does this all mean that solar is dead?
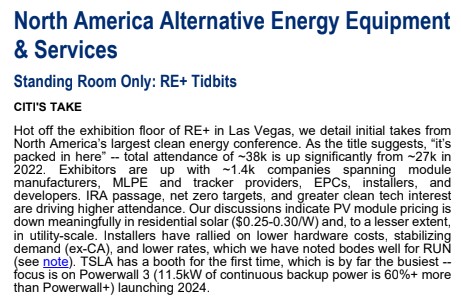
More likely on pause. Just this week Citigroup described the exhibition floor in Las Vegas at North America’s largest clean energy conference as “standing room only”.
Source: Citigroup Research
The question of solar stocks bottoming is “when” not “if”. But finding that bottom has proven extremely painful for investors.
WHEN WILL IT BOTTOM?
SolarEdge CFO Ronen Faier gave a sober assessment at an investor conference recently: we’re not there yet.
Faier said that Europe’s Q3 and Q4 would continue to be weak. Europe’s inventory problems are being exaggerated by cash flow issues from distributors. Distributors are delaying orders, even those “that they will need in Q4″ because of their cash crunch.
But this will pass. By the end of Q4 or at latest Q1 next year Faier believes European inventory will stabilize – with as little as a month on hand.
Meanwhile the underlying market continues to grow at 30% to 40%. That means the pickup could come quick – as growth asserts itself and distributors expand inventory-days once their cash crunch eases. This dynamic applies to both inverters and batteries.
In the United States the picture is muddier. Faier was blunt, saying that “underlying demand is not growing this year”, that it is “maybe even declining” and that the trend could continue into 2024.
That view is also held by Wells Fargo. Wells expects a 13% decline in residential solar demand in 2024. The reasons?
- Natural gas prices
- California NEM 3.0
- Interest rates.
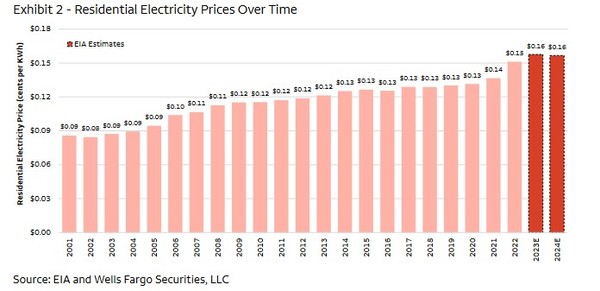
The EIA is forecasting a decline in US electricity prices in the US in 2024 due to lower natural gas prices.
This would be the first decline since 2018. While their forecast price decline is modest – only 1% – residential solar has had a big tailwind for the last 5-years as energy costs have done nothing but go up.
Source: Wells Fargo
A second headwind comes from California’s new NEM 3.0 legislation, which was put into place April 15th, 2023. California has been the biggest market for residential solar.
The changes enacted by the California Public Utilities Commission, significantly cut export rates for extra electricity generated by new installations.
NEM 3.0 slashed California’s export rate by about 75% – from a current average of around 30c/kWh to as low as 5c/kWh depending on the time of day.
The result has been a big decline in demand. Permits for new installations have been declining since the change took effect. Wells Fargo believes September permits will be down 23% YoY and that the number could increase to -40% YoY by November.
But there is a silver lining. While California has lowered the average rate paid for solar produced, that rate varies with time of day. During peak demand times (in the evening) the rate paid increases substantially – to the same level it was in the past.
This strengthens the case for storage. Enphase is already on it, introducing a new next-gen battery product specifically designed to deliver power into a NEM 3.0 environment.
Also helping the case for storage, both in California and elsewhere in the US, is the Inflation Reduction Act (IRA). The IRA extends already existing credits for residential solar to include stand-alone storage.
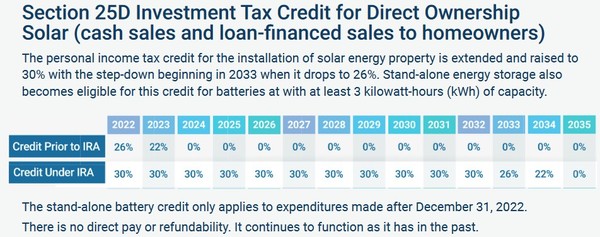
Source: Solar Energy Industries Association
The other positive (well sort of) is that YoY comps can only last a year!
Wells Fargo believes that once we get past April, the numbers will improve. In addition to easy comps they expect California installers to figure out how to sell into the new environment. Wells sees permitting “improving significantly” beginning in April, with recovery to pre-NEM 3.0 levels by October 2024.
For the rest of the US, the final headwind to demand has been rising interest rates. When and if interest rates decline is anybody’s guess. What I will say here is that even stabilizing interest rates should help demand.
I wrote about Sunlight Financial (SUNL – NASDAQ) in a blog post a few months ago. Sunlight is a very beleaguered solar financing company. They provide credit to homeowners installing residential solar.
Sunlight’s #1 problem has been interest rates. Not so much the level of interest rates, but the rise of interest rates.
What do I mean? Sunlight: A. makes loans to homeowners for solar, and B. packages them up into securities and then sells those securities off to investors.
A look at Sunlight’s stock price is all you need to see how that has gone.
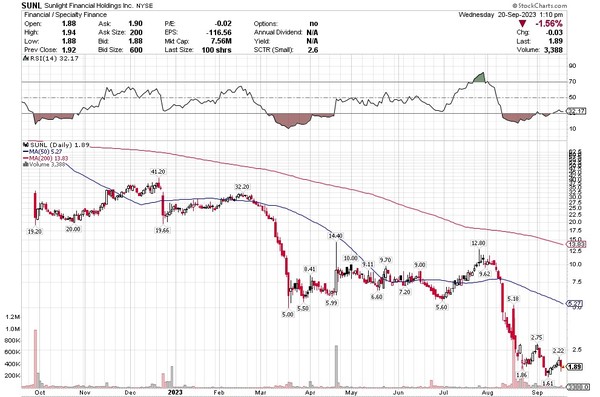
Source: Stockcharts.com
Sunlight got into trouble as rates rose through 2022 and then spreads widened in 2023. Loans they made a few months before were suddenly worth less because of higher rates. Sunlight was left holding the bag on loans that they couldn’t sell without taking a haircut.
While it may be too late for Sunlight, it would help lenders like Sunlight a lot if rates and spreads just did nothing for an extended period of time.
UTILITY SOLAR DOESN’T BLINK
The argument that it is the pace of change in interest rates and not the level of rates that matters most is supported by the utility solar market.
While residential solar growth has hit a snag, the utility solar market has kept trucking along.
Morgan Stanley put out a note just this week where they said “developers and EPCs nearly unanimously conveyed a sense of unwavering conviction… for utility scale solar”.
Why is utility solar continuing to fare so well? Because these larger players still have access to capital and solar is still the cheapest new capacity around.
Power price agreement pricing for new utility solar is significantly better than what is needed to build a new gas co-gen plant.
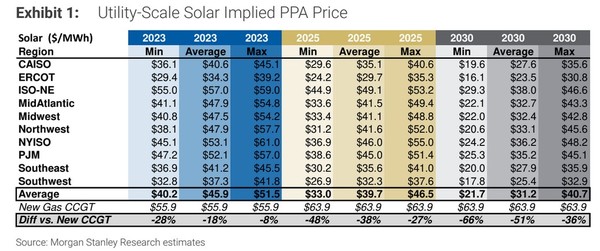
Source: Morgan Stanley
FALLING PRICES
Solar install demand and polysilicon pricing have fallen dramatically. Citi pointed out that their discussions with solar module manufacturers indicate that “residential module pricing is down ~50% Y/Y with pricing in the $0.25-0.30/W range for ~370-420W panels.”
Now that’s liquidation! See this chart of polysilicon pricing, which is down 75% in the last 12 months.
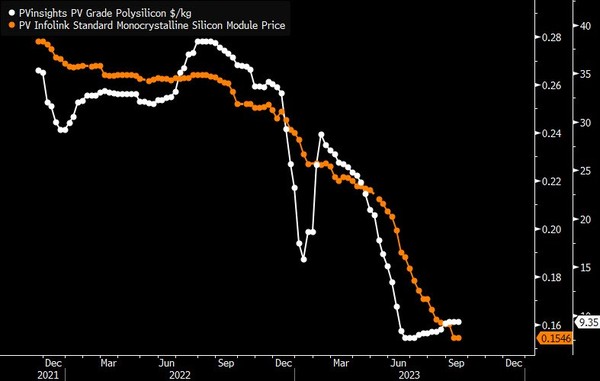
Source: Bloomberg
You can look at it two ways. Either “oh my God the sky is falling” or “this is bound to spur more demand”.
Falling module pricing make solar more attractive. That will set the base for a recovery. Each bear market is the seed for the next bull run.
Much of the same could be said for the stocks of Enphase and SolarEdge, which have charts that are pretty similar to the module and polysilicon pricing charts above.
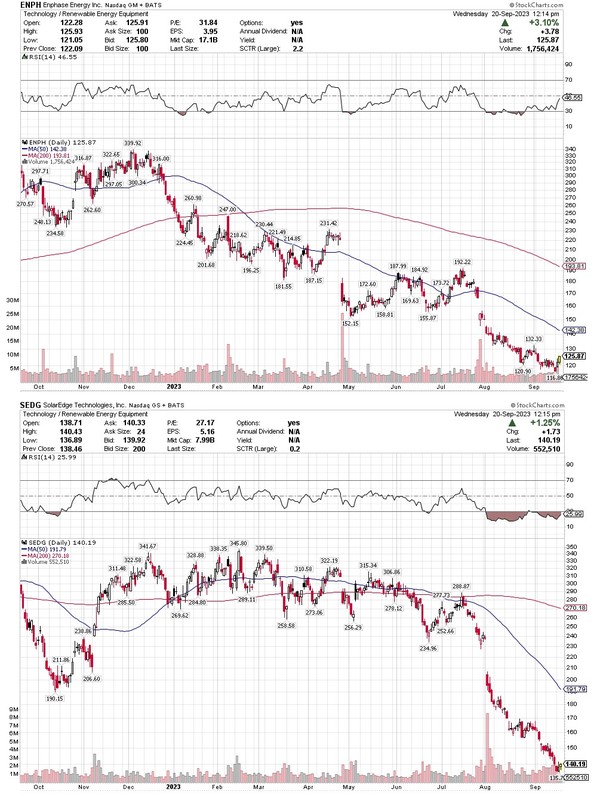
Source: Stockcharts.com
Neither of these stocks has ever been “cheap”. But after the recent swansong they are getting close.

Source: Sentieo
Both stocks now trade at multiples below the market average. In the case of SolarEdge, significantly below.
That doesn’t mean that they can’t get cheaper. And the solar market has not bottomed just yet. But it is likely getting close. A bottom in Q1 2024 seems more likely than not.
If the typical performance of these stocks holds true, they should bottom ahead of that. Which could be any day – if you can handle the pain.


