
The energy sector hasn’t represented this small of a percentage of the S&P 500 since the peak of the technology stock bubble in 1999.
No coincidentally–that was one really, really great time to be buying oil stocks.
I pulled the table below from the S&P data archives. It tells us the percentage of the S&P 500 each sector represented at three distinct points in time (1999, 2007 and Q2 2018).
What I see in the data is incredibly telling; so simple, yet so powerful.
Let’s focus first on 1999:
| S&P 500 Weights Over Time (Sectors) | |||
| 1999 | 2007 | 1Q18 | |
| Sector | Weight | Weight | Weight |
| Consumer Discretionary | 12.7 | 8.18 | 13.08 |
| Consumer Staples | 7.17 | 10.42 | 7.66 |
| Energy | 5.55 | 12.73 | 5.75 |
| Financials | 13.02 | 18.08 | 14.76 |
| Health Care | 9.31 | 12.39 | 13.64 |
| Industrials | 9.91 | 11.55 | 10.29 |
| Information Technology | 29.18 | 15.85 | 27.21 |
| Materials | 3 | 3.42 | 2.85 |
| Telecommunication Services | 7.94 | 3.53 | 1.91 |
| Utilities | 2.21 | 3.87 | 2.85 |
| 100 | 100 | 100 | |
| Source: FactSet |
With the benefit of hindsight we know today that in 1999 investors should have been fleeing technology and expensive consumer discretionary stocks. At the same time in 1999 investors should have been getting long energy and boring value stocks like consumer staples.
The data shows that in 1999 those stocks that investors should have been avoiding (technology and consumer discretionary) were peaking in terms of their representation in the S&P 500. Meanwhile at that same time the sectors that we should have been buying (energy and consumer staples) were bottoming out in terms of S&P 500 representation.
Now fast forward to 2007.
At this point in time the energy sector and value stocks like consumer staples have had tremendous runs in the years following the 1999 tech bubble collapsing.
The representation of energy stocks and consumer staples in 2007 is much higher, in fact at peak levels. Meanwhile the representation of technology stocks and consumer discretionary stocks had plummeted.
| S&P 500 Weights Over Time (Sectors) | |||
| 1999 | 2007 | 1Q18 | |
| Sector | Weight | Weight | Weight |
| Consumer Discretionary | 12.7 | 8.18 | 13.08 |
| Consumer Staples | 7.17 | 10.42 | 7.66 |
| Energy | 5.55 | 12.73 | 5.75 |
| Financials | 13.02 | 18.08 | 14.76 |
| Health Care | 9.31 | 12.39 | 13.64 |
| Industrials | 9.91 | 11.55 | 10.29 |
| Information Technology | 29.18 | 15.85 | 27.21 |
| Materials | 3 | 3.42 | 2.85 |
| Telecommunication Services | 7.94 | 3.53 | 1.91 |
| Utilities | 2.21 | 3.87 | 2.85 |
| 100 | 100 | 100 | |
| Source: FactSet |
Can you guess what investors should have been doing in 2007?
It is called sector rotation!
In hindsight, this is all quite obvious. The correct move in 2007 was to get out of energy stocks and consumer staples and start getting into tech stocks and consumer discretionary.
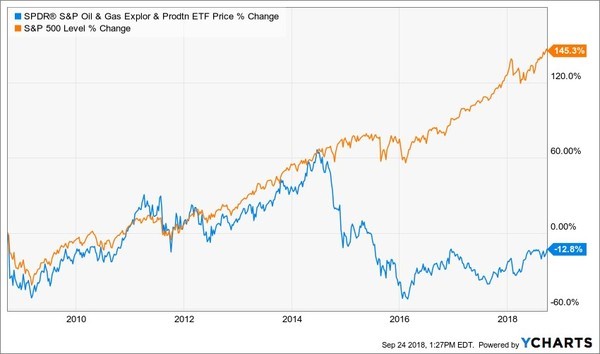
Since then while the overall S&P 500 is up 145%–thanks to technology stocks–the energy sector has posted a negative performance of 12%.
Now let’s jump forward in time once again to bring us to where we are today in 2018.
Maybe we can use something that we have learned from history to help us today.
Here are the current sector weightings….
| S&P 500 Weights Over Time (Sectors) | |||
| 1999 | 2007 | 1Q18 | |
| Sector | Weight | Weight | Weight |
| Consumer Discretionary | 12.7 | 8.18 | 13.08 |
| Consumer Staples | 7.17 | 10.42 | 7.66 |
| Energy | 5.55 | 12.73 | 5.75 |
| Financials | 13.02 | 18.08 | 14.76 |
| Health Care | 9.31 | 12.39 | 13.64 |
| Industrials | 9.91 | 11.55 | 10.29 |
| Information Technology | 29.18 | 15.85 | 27.21 |
| Materials | 3 | 3.42 | 2.85 |
| Telecommunication Services | 7.94 | 3.53 | 1.91 |
| Utilities | 2.21 | 3.87 | 2.85 |
| 100 | 100 | 100 | |
| Source: FactSet |
Does anything look familiar?
I should say so……could the sector representation today look any more like 1999? Here we are almost twenty years later and we are confronted with almost the identical situation.
Both the energy sector and consumer staples have shrunk as a percentage of the S&P 500 while technology and consumer discretionary have once again soared.
Energy sector representation is down to the lowest level in twenty years–when investors should have been buying them hand over fist.
Technology stocks are again almost a third of the market–as they were in 1999 when they should have been avoided like the plague.
I’m not saying that this on its own is an ironclad reason to buy energy stocks and get out of the tech sector today.
But it isn’t just this on its own……
The Price Of Oil Has Roared – Energy Stocks Have Yet To Hear It
The most important factor in the amount of cash flow that an oil producer can generate is what?
This isn’t a trick question, the answer is exactly what you think it is……the price of oil!
Great news then right?
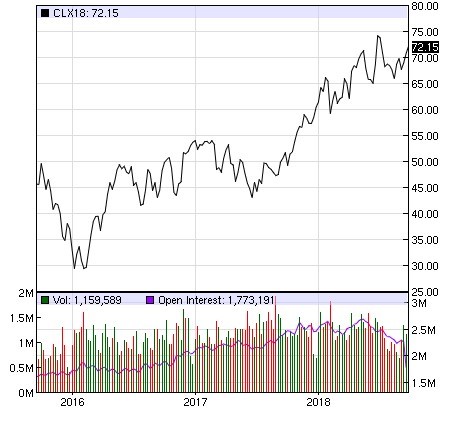
Since bottoming at $26 per barrel in 2016 the price of oil has rocketed higher, not a million miles now from tripling off the bottom.
That is obviously positive for oil producers, but I don’t think many people appreciate just how positive.
The benefit to the cash flow of oil producers from a rising oil price is much larger than most investors realize.
Certainly much larger than even the big move in the price of oil since 2016.
I’ll show you with a very simple example.
Imagine an oil producer that incurs costs operating costs of $25 to produce a barrel of oil. With an oil price of $30 per barrel that producer is making a profit of $5 per barrel produced.
Simple.
If oil prices then increase to $70 per barrel the cost of producing that oil doesn’t really change much. Most of the costs of production are fixed — other than royalties.
The cost to produce a barrel of oil at $70 oil prices isn’t much different than the cost to produce a barrel of oil at $30 oil prices.
With production costs relatively fixed at $25 in our example, that means that the oil producer’s profit per barrel then goes from $5 per barrel with $30 oil all the way to $70-$25 = $45 per barrel at $70 oil.
So while the price of oil has more than doubled from $30 to $70 per barrel, the producer’s cash flow has gone up nine fold from $5 to $45 per barrel.
Again to be clear this is a very simplified example because royalties are a variable cost to be considered, but this leverage to oil prices increasing is very real for producers. Cash flow percentage increases for these companies have moved multiples of the percentage change in oil prices.
With that in mind I have to ask how it makes sense that the price of oil has nearly tripled from the bottom………
Yet the share prices of oil producers which have experienced cash flow increases multiples of that are still stuck in the doldrums?
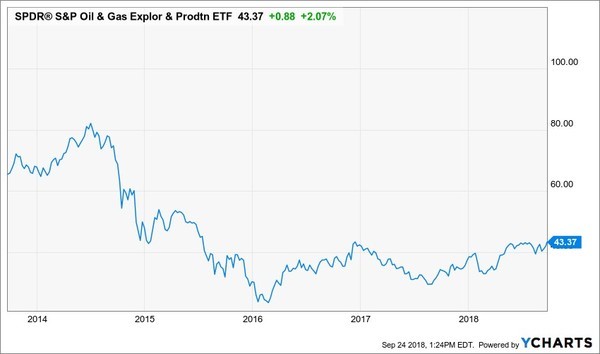
The answer is that it doesn’t make sense.
The share prices of oil producers should have widely outperformed the rise in oil prices. Eventually they are going to…..
It Is Going To Look Like A No-Brainer After The Fact
Hey, I get it.
Investors haven’t had a positive experience with the energy sector in so long that they have given up on it.
It is hard to get excited about these companies that haven’t rewarded investors for such a loooooooong time.
But —- history has shown us that this is exactly the time to get into a sector. When everyone else has left the building.
On top of all of this we know that the sector is cheap. Cash flows have skyrocketed for these companies with the move higher in oil prices yet the stock prices haven’t moved.
That has compressed valuation multiples.
The energy sector has become a coiled spring. When it eventually takes off the move is going to be big. When we look back on in this in the future today will be thought of as a time when getting long the sector was a no-brainer decision.
Here is the important part……..
This no-brainer opportunity isn’t in the future. You need to do it now.
I’m playing this huge spread via one oil stock…here’s why:
1. Very fast growing production levels
2. Some of–if not THE–most profitable production in North America
3. The Chairman has over $40 million of his own money in the stock
4. It’s an American play, where there are no discounts or pipeline issues
5. They have buckets and buckets of cash
I expect this stock will help me retire a lot faster than I ever thought possible–and it’s only $2/share! Get the name and symbol by clicking HERE.

 VS. TECHNICALS (GOOD)")


