
Investors are trained by analysts and management to talk about oil prices when looking at energy stocks.
But that’s a misnomer; a mistake even—especially in the United States, where the hydrocarbon geology is deeper and gassier than Canada. And natural gas is worth a lot less than oil.
Investors sadly pay almost no attention to the realized price per barrel that companies receive—the integrated natgas/oil price—just to what the price of oil is doing on the day of the quarterly report comes out, or what the average price of oil during that quarter.
I worked with one of my researchers, studying 37 small-to-mid-tier energy producers in the United States—the names on all the brokerage analyst reports—and discovered some facts most energy investors may not believe:
- 65.9% of production was natural gas or low-priced NGLs (Natural Gas Liquids)
- Therefore only 34.1% of production was oil
- That ratio put the average realized price per barrel of the 37 in December 2016—when WTI was $50 and natgas was $3—at just $28.37/barrel.
- We back-tested this to Q3 2014—top of the Market—and found that with WTI at an average $97.37/b, and natgas at $3.95/mmbtu, the 37 companies realized an average price of just $46.30/b.
- All-in costs (production + maintenance capex + taxes) were $54.57—so even at $100 oil these producers were losing $8.27 on every barrel!
There is obviously some big variances between companies, but overall it tells three stories:
- helps investors understand why “oil” stocks don’t make money (because investors are not looking at realized pricing per barrel).
- How low natgas prices can really drag down “oil stocks” cash flow
- Help investors focus in on the best bang for their oil buck—which could be Canada, where a lot more companies have 90% + oil weightings
Now, assuming that 34.1% oil/65.9% natgas split, here is a matrix that suggests what the realized price per barrel would be for our small 37 company universe:
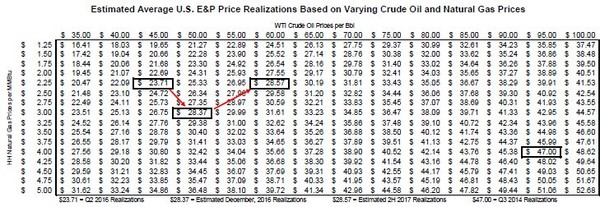
The black highlighted box in the lower right corner is roughly where these 37 companies were in Q3 2014–$47.00 realized pricing between their oil and natural gas. The $28.37 box is our guesstimate for realized pricing in December 2016. The $23.71 box is where Q2 2016 realized prices were, when natgas was really low. If natgas goes back to that $2.25 price level—and winter now looks to be effectively over with a warm February forecast—the $28.37 realized pricing box that is highlighted is what could be very realistic for the second half of 2017 at $60/b WTI.
Natgas prices have a huge impact on the cash flow for “oil stocks”.
Here is a list of the 37 stock chosen for the study, in order of oily to gassy (primary Permian stocks in yellow; I’ve been focusing almost all my attention on the Permian in the last year):
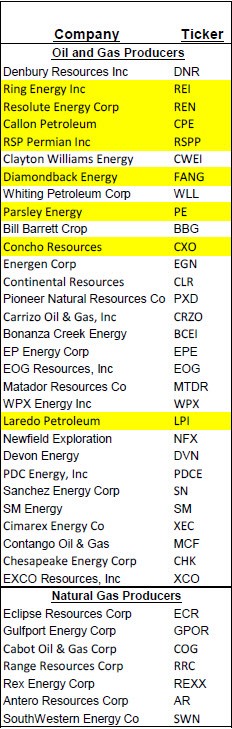
The oil ratio drops off quickly in these 37 US E&Ps—only Denbury has over 90%, and only Ring Energy (going after a shallow formation in he Central Platform, is also above 80%. Concho is already down to 61.6% oil.
Both the Permian and the Bakken are “oil” plays, but Continental (CLR-NYSE)–the poster child of the Bakken–was rarely ever over 70% oil. And looking at the EIA drilling report from last month, new production out of the Permian was only 76% oil–and those wells tend to get gassier as they age (which is why you will see producers add rigs as fast as they can in the Permian to keep their oil weightings higher)
Our little study really shows that investors should take a more integrated view of oil and natural gas prices: Few investors—or even analysts—appreciate that a decline in natgas prices to $2/mmbtu would offset a roughly $12/b increase in crude oil prices (actually the analysts do realize that, but it would make selling these stocks more difficult to institutions and retail ;-)).
Now, contrast that to Canada. Canadian geology is shallower, so by definition its production is more oily. The deeper the geology, the more heat and pressure in the rocks, which “cooks” the hydrocarbons over time into first heavy oil, then light oil, then liquid rich gas, then dry gas—each one being lower down than the previous one.
Obviously the oilsands companies have the shallowest geology—at surface. Then the SAGD producers (Steam Assisted Gravity Drainage), where two long heated pipes warm up bitumen and collect oil. Then there’s the light oil producers in southern areas of both Alberta and Saskatchewan. All the companies in these plays have mostly 90% + oil.
US E&P share prices will move higher if WTI crude climbs above $60/b in 2017, BUT the rally will be muted if natural gas prices fall–and I’m one of the more bearish on the Street for natgas–and service costs rise.
EDITORS NOTE: How many energy companies are increasing dividends these days? Precious few. But I found one that has guaranteed increases coming…for the next 14 years. Stay tuned. Dividends support stocks like nothing else in good times and bad and….ever notice how expensive this market is?

 VS. TECHNICALS (GOOD)")


