Dear OGIB Reader,Today’s story comes from Cory Mitchell, who explains how the charts of oil and the overall market are now hauntingly like the 2006-2008 period—but in the short term, that means now could be a good time to own stocks.- Keith
Commodities and stocks have been moving closely together since the 2008 financial crash. But this relationship is starting to hit the rocks, with stocks moving higher and commodities moving lower.
In this nervous, overall market, it might seem logical to assume that stocks will begin to drop (more so than we have seen in the last few days) with commodities…but I propose a different likelihood.There is some strong recent chart history that shows oil and the stock market is trading a compressed version of late 2006-late 2008. That should mean a continued love affair between the two sectors through to Q4 2012, with both rising (giving investors some love too)—but end badly, with both dying late this year or early 2013—just at slightly different times (think Romeo and Juliet).
In this article I’ll explain:
The current environment mirrors a pattern seen several years ago.
This pattern coupled with the long-term technical picture could drive the S&P 500 to 1500+ before the end of the year—a more than 10% jump from current levels. Oil is also likely to make another move higher boosting the energy sector in the latter part of the trend.
The rise is likely to create a stock market peak late in 2012, leading to a significant decline.If this materializes (or if it doesn’t), certain price levels can be used to as guides for trading this market.
The Recent Stock and Oil Relationship
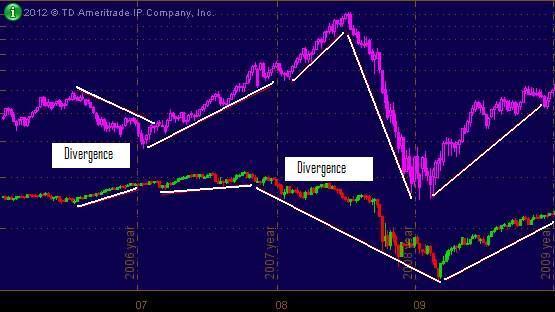
Look back at 2006: oil dropped through the latter part of the year but stocks continued to climb. During most of 2007 stocks and oil move higher, in unison, but decoupled in late 2007 with stocks going down and oil going up. See the divergence on this chart.
Figure 1. S&P 500 (Red and Green) Vs. Crude Oil (Pink), 2006 to 2010

Source: TD Ameritrade
The times of significant decoupling are marked “Divergence.” In the first divergence we have stocks up, commodities down. Later, we have stocks down, commodities up—a sign more typical of a major commodity top and nail in the coffin for equities. For example, it was that final push in oil up to $147 in mid-2008 as equities had already rolled over (peaking October 2007) that killed the equities at the end of the trend. And then Romeo and Juliet collapsed together.
Right now, I see that we are in the same trading pattern, but only in the late 2006 part. This means the commodity and equity top is coming…but likely not yet.
The Current Environment
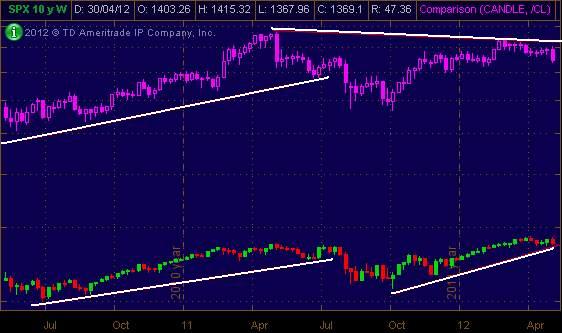
Since 2009 stocks and oil have been moving in unison… until recently. Based on Figure 2 below, oil has been showing a slight divergence with stocks since hitting a high in May, 2011. The recent rally was unable to reach those heights and has started to decline once again.
Stocks on the other hand have hit new highs in 2012 — leaving the uptrend unquestionably intact up to this point.
Figure 2. S&P 500 (Red and Green) vs. Oil (Pink), May, 2010 to Current

Source: TD Ameritrade
The last few months are especially interesting — Oil has been declining since March and stocks have risen. To me this looks a lot like the occurrence which took place in the last half of 2006—at least the start of it.
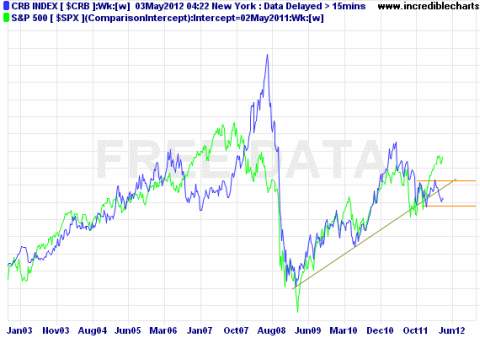
Commodities overall, represented by the CRB Commodities Index, show the past and current divergences more clearly.
Figure 3. CRB Commodities Index (Blue) vs. S&P 500 (Green)

Source: Incrediblecharts
Note the similarity between now and 2006. Overall commodities and stocks are in an uptrend—but stocks are pushing ahead as commodities decline—just like in 2006. We can see what happened in 2007 and 2008 following that divergence—in 2007 both commodities and stocks rallied until October, then an eight month divergence until the final collapse together.
Could that same scenario happen now? I believe it can, although I don’t believe we will have a massive spike in oil like we did in 2007 and 2008.
What the Current Decoupling Implies
If we are seeing another situation like 2006—with oil dropping and stocks rising (or at least holding steady)—it will be a good time to own stocks for the short term. While markets always gyrate I continue to believe the current market environment is a favorable one for investors.
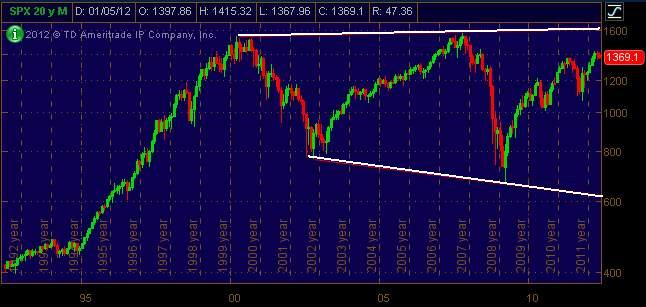
Also, the rally in stocks appears to be incomplete. If we look back to 2000 we see the market in a large expanding range as shown in Figure 4—higher highs and lower lows; the chart looks like a megaphone.
If that happens, I see the S&P 500 moving very close to upper portion of that expanding range this year. I don’t believe stocks will explode higher from current levels but rather continue making see-saw moves higher to near 1500 to 1550 on the S&P 500 (right below the expanding range threshold and near 2007 highs). For investors that still means a lot of potential upside—likely 10%+ from current levels.
Figure 4. S&P 500 20 Year Monthly Chart (1992 to Current) – Expanding Range

Source: TD Ameritrade
What to Watch For
The situation now is similar to late 2006, leading into 2008. Oil could decline for the near term as stocks continue to rally, or at least hold above support levels (discussed shortly). The push higher in stocks presents an opportunity for investors to catch the tail end of this long-term rally which began back in 2009.
After a short-term decline (happening now) oil is also likely to follow suit putting in its high after the stocks market has already begun to decline—just like in late 2007.
Historically the energy sector shows strength late in trends, often to due to this last push higher in oil, as broader indexes such as the S&P 500 have already turned lower. Therefore, watch for the energy sector to pick up over the next several months as oil puts in a final thrust higher. I do not expect oil to rally aggressively as it did in 2008; it is more likely to peak at $120 or below.
How to Trade It
Nothing moves in a straight line and what has been discussed provides a general structure of what I believe will unfold. Short-term declines in the S&P 500 are likely to bottom out in the vicinity of 1340 or above (within about 30 points of current levels), ultimately rallying to near the 1500 region over the next several months.
Oil could continue to decline but is likely to begin moving higher, ultimately peaking after stocks have peaked—near $120 is likely to be high for oil before it too sees another significant decline (Romeo and Juliet die).
That leaves some time to buy stocks for what could be further upside. If the S&P 500 holds above 1340 look for the energy sector to be a leader late in the trend as the market continues to push higher.
In the closing months of 2012 I believe the upper band of the expanding range (the top of the megaphone) will have been tested in the S&P 500, and it will again lead to a major decline (October top again?). That stills leaves several months though that are likely to be good months for the markets, especially buying on pullbacks into support areas like we are currently seeing.
In terms of managing risk, 1340 is the level I am watching on the S&P 500; based on the technicals I believe the level should hold, for those who like to leave a bit more room 1300 is next level to watch. If the latter is breached it is a major warning signal. If support is found above these levels expect a move up to 1500 or slightly higher.
– Cory Mitchell, CMT


