Why oil services stocks are outperforming oil producer stocks
There are several other ETFs that track the shares of oil and gas producers and services companies, although those other ETFs do not experience the same magnitude of trading volume as the XLE and OIH ETFs.
The XLE ETF tracks the shares of U.S. large-cap oil and gas companies with recent trading volume about 10 to 20 million units per day. This ETF has a heavy weighting of Exxon Mobil Corp. (XOM-NYSE, $72.80), which significantly influences the direction of the ETF. Since XOM has lagged the XLE ETF during the last several months the recent influence has been a drag on the ETF’s performance.
The OIH ETF tracks the Philadelphia Oil Services Index (OSX, 242.22), which is comprised of the shares of U.S. large-cap oil and gas service companies. Recent trading volume is about 4 to 5 million units per day. This ETF includes oil and gas service companies such as Schlumberger Ltd. (SLB-NYSE, $82.81), Halliburton Co. (HAL-NYSE, $40.41) and Baker Hughes, Inc. (BHI-NYSE, $56.76), which have all outperformed the OIH ETF since Sept. 1.
The comments below provide a technical analysis of these two ETFs in terms of the current price chart pattern that each ETF’s price action has formed and their relative performance against each other, but first a refresher on support and resistance levels.
A support level for the price of a security or ETF is the level at which buyers have become as powerful as sellers and stop a price decline. Whereas resistance is the level at which sellers have become as powerful as buyers and stop a price advance. A resistance level becomes a support level after an upward breakout of a resistance level occurs, whereas a support level becomes a resistance level after a downward breakout of a support level.
As you can see in the chart below, except for the big pull-back in the spring of 2010 after the BP Amoco PL (BP-NYSE, $43.61) gulf oil spill, the OIH ETF has outperformed the XLE ETF since Dec. 1, 2009. The trend lines on the ratio of the OIH unit price to the XLE unit price as well as the RSI and OBV technical indicators favour continued outperformance by the OIH ETF, but breaches of those trend lines may change the bullish outperformance case for the OIH ETF.
“—-ing Will Change Everything”
Technology, by its very nature, creates change.
But there’s one technology in particular that is causing massive changes in the oil and gas exploration industries.
Now…I can’t give it all away right here. But rest assured – “—–ing” is a technology understood by very few.
But at the same time, “—–ing” is about to create explosive short-term profit opportunities for those investors who know where to look.
That’s where I come in.
I’ll tell you all about “—–ing” – yes, including the actual name – and how you can claim your share of the fortune that’s about to be made.
I’m talking about more than a dozen triple-digit profit opportunities over the next 12 months.
Click here to learn more right now.
XLE’s unit price bounced around a price range of US$50 to US$60 during the period August 2009 to October 2010, and managed to penetrate the US$61 resistance level in November 2010, which has become the support level. The unit price has traced out a fairly steep rate of ascent, which is unlikely to be sustained, although the move above US$67 has confirmed the breakout. The bullish trend may continue through the winter months should XLE’s unit price find support at US$61 and then make some higher highs and higher lows.
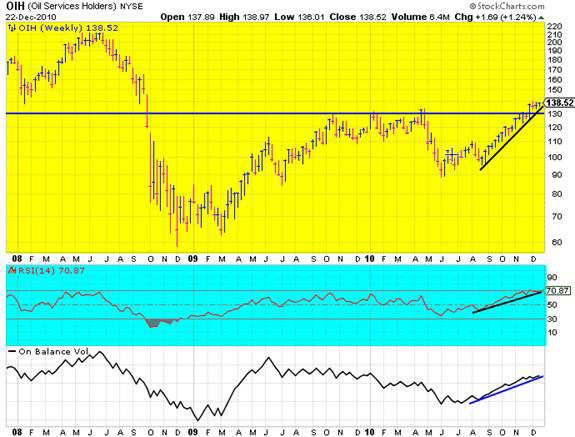
OIH’s unit price has bounced around a much wider US$90 to US$130 price range during the period August 2009 to November 2010, which is quite volatile. The unit price managed to penetrate the US$130 resistance level in November 2010 and has also traced out a fairly steep rate of ascent, which is unlikely to be sustained. The bullish case for oil services companies outperforming oil producers is strengthened should OIH’s unit price confirm a breakout with a move up to US$143.

Notice how the resistance level of each ETF was breached in April of 2010, but the unit prices quickly dipped below those levels quite substantially after April. Essentially, the sellers became more powerful than buyers and stopped those advances. Recall that there was general market weakness in May. These false break outs, or whip saws, have a greater probability of occurring if the price movements are less than 10% above the resistance level. Normally, a break out is confirmed by a 10% price move above the resistance level, although with penny stocks you would generally want to see at least a 20% price increase to confirm a break out.
There significant short interests in both ETFs’ units (i.e. 40 million, or 35.6%, of XLE’s 112.4 million outstanding units and 6.5 million, or 36.1%, of OIH’s 17.9 million outstanding units), so a short-covering rally could take their unit prices considerably higher, although the unit prices will not diverge much from the net asset value of underlying market constituents of each ETF.
Conclusion:
The broader stock market is due for a pull-back, which could take the XLE and OIH unit prices to their support levels, which would provide low-risk entry points. For OIH, a move to US$143 first to confirm the breakout would improve that ETF’s technical outlook.
Disclosure: I don’t currently own any units of either the OIH or XLE ETFs or common shares or debt of any of the companies mentioned in this article.
Brian Hoffman, CA, CPA, is a member of the Canadian Society of Technical Analysts (E-mail: bk.hoffman@rogers.com).


