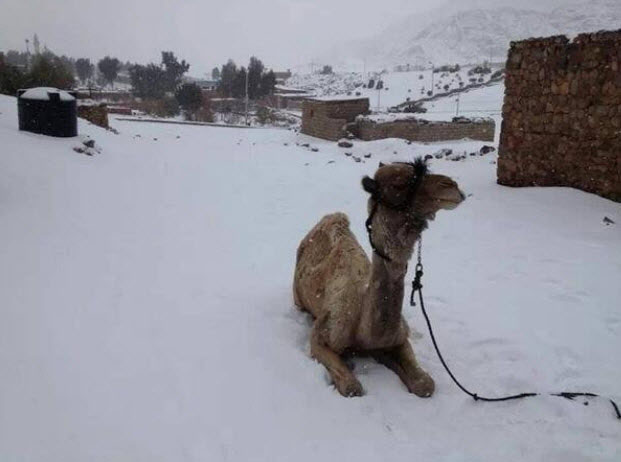
Three months ago, it snowed in Cairo, Egypt for the first time in 112 years.
2013 was the largest one-year temperature drop ever recorded in the United States.
The extent of the Antarctic sea ice is at record highs.

It’s the Real Inconvenient Truth—right now the world is getting colder. And it’s likely to get even colder for the next 20 years—before a new, stronger cycle of sunspots begins, as they have for eons. They are statistically very, VERY accurate.
But there’s more, and it’s A Sad Truth: there is ample evidence that suggests private scientists and public servants have been manipulating the basic raw data that most everyone relies on to calculate climate change. (This story has great timing as the IPCC–International Panel on Climate Change–just released Part 5 of their most recent major assessment on climate science (even they can’t bring themselves to call it Global Warming anymore).)
There are some investment trends that come out of this new Truth, and some of it is as simple as get long snowmobile makers and get short lawn mowers. One trend is that Global Cooling should bring more seasonality in oil and gas prices, making energy ETF and commodity traders happy.
All of this is part of a new ground-breaking study completed by Unit Economics, an investment think-tank from Boston. They are a non-partisan group with no axe to grind on this issue; like me, they are here to make money for their clients. Show us a trend and we’ll figure out how to profit from it.
In Part I, you’ll understand the big swings in temperature the earth has experienced in the last million years, and the last thousand years, and the last 50 years. In Part II I’ll explain how sunspot activity directly correlates to ALL these temperature changes. And I’ll give you a hot, near-term investment trend to capitalize on this cool idea.
And in Part III, I’ll show you how some original research by Unit Economics has uncovered some disturbing data about the integrity of Global Warming science. And really, all they’re doing is adding to an already big pile.
BACKGROUND AND CONTEXT
Satellites first started measuring earth’s temperature in 1979. Over the next 20 years, temperatures did rise, by roughly 0.5 degrees Celsius (0.9°F). In the 15 years since, that trend has reversed–rendering the total temperature increase since 1979 a mere 0.35°C (0.6°F), well within the range of statistical noise.
The real culprit for climate change is simply—the sun, through a complicated but predictable set of cycles.
Those cycles predicted today’s cooling trend – and they predict it will continue for another two decades and may well lead to the coldest period on earth in the last 1,200 years.
The Earth, the Sun, and the Temperature
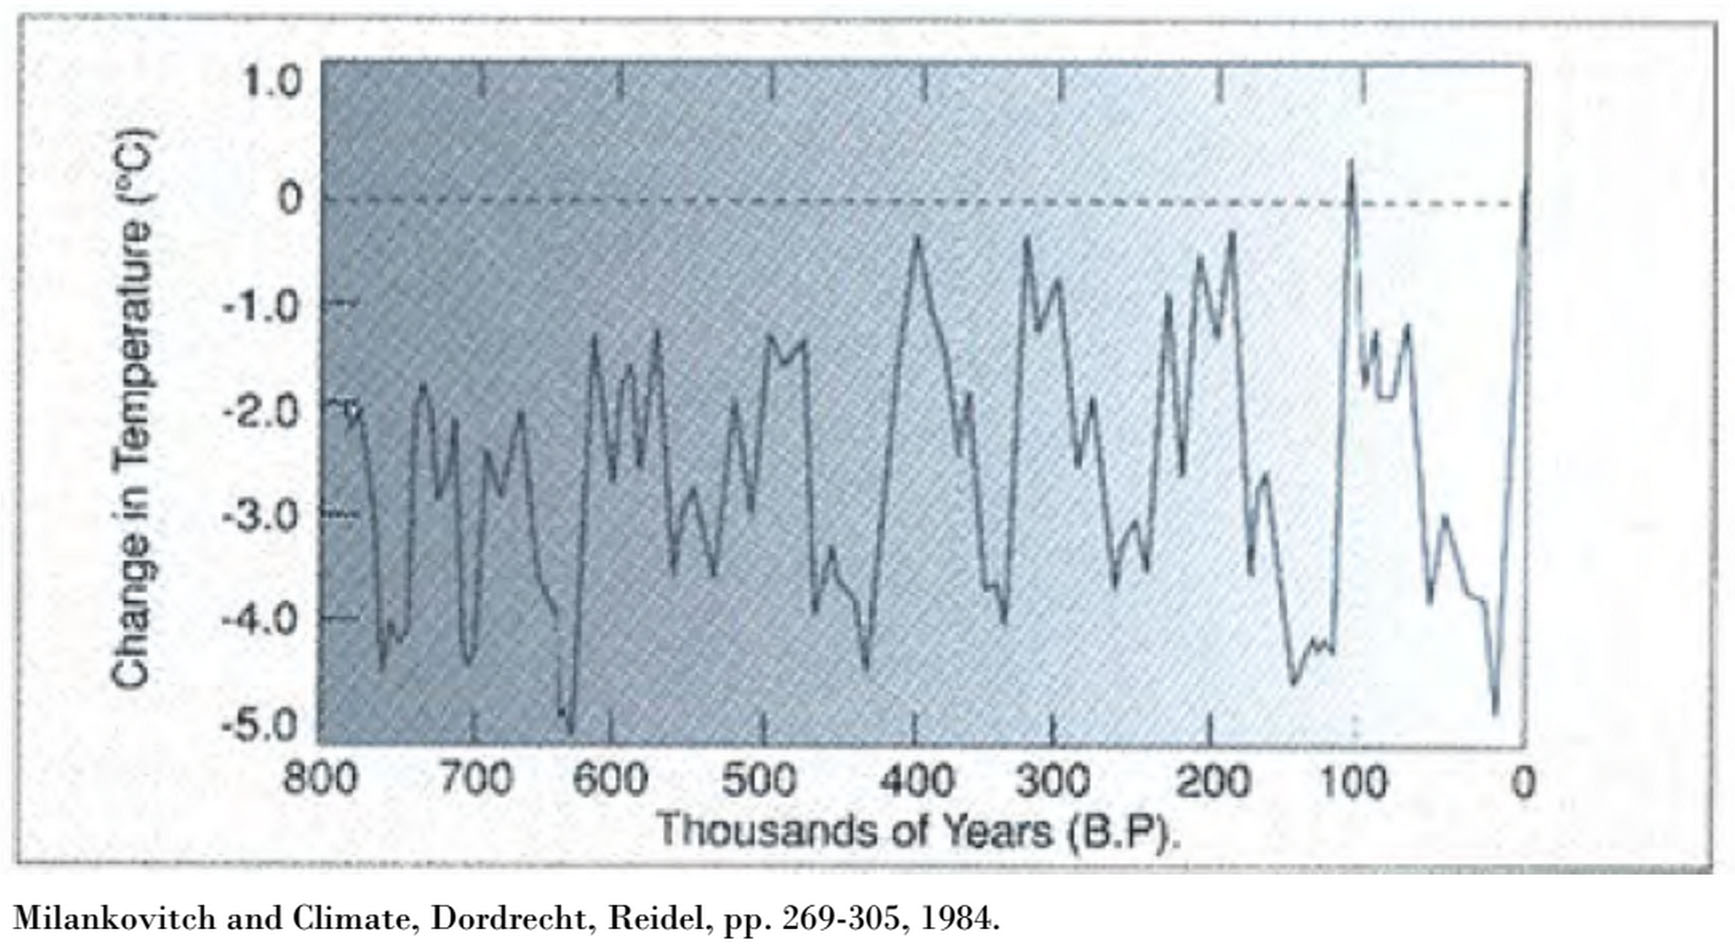
The earth’s cycle around the sun stretches and contracts, creating 100,000-year temperature cycles. Our planet also slowly tilts one way and then the other, resulting in 41,000-year temperature cycles.
We know this because scientists have several methods to estimate historic weather, an effort that has produced this general result:

A few things jump out.
1. The 100,000-year temperature cycles are very apparent – and the current one is peaking.
2. The timeframe of this chart covers ice ages and tropical periods, which means it takes only a small change in global temperatures – only two to four degrees – to separate a very warm world from a very cold one.
3. Through the cycles of the last 800,000 years, the average global temperature is creeping upwards.
4. The magnitude of each cycle seems to be increasing.
Now, this chart should be taken with a grain of salt because the methods we use to conjure these numbers are not perfect. But at least the chart lets us put recent climate changes into historic context – a context that deserves a closer look.
The key takeaway is that the earth has been through some very warm periods and some pretty cold ones. Take the years between 800 and 1200 AD, for example. During these 400 years it was so warm that vineyards spread across central England and bountiful harvests almost doubled Europe’s population.
Then it all changed. By the mid-1300s England’s vineyards were gone and sea ice expanded so much that polar bears crossed to Greenland. This short cold snap was truncated in about 1400, when warmer weather returned for 150 years. Get the idea? Up, then down, then up, then down. And then came the Little Ice Age.
Lasting from 1550 right until 1850, the Little Ice Age froze Austria’s vineyards, forcing parched Austrians to switch from wine to beer. Winter fairs were held on the frozen Thames River for 20 years (you’ve all seen the paintings) and Hudson Bay was littered with ice chunks in mid-summer.
This period of time was so cold it earned the moniker The Dalton Minimum—a reference to the very low number of sunspots then. In the year 1816, storms dumped snow across New England and Quebec in June, lake ice lasted until August in Pennsylvania, and failed crops led to food riots in Britain and France.
So when you get asked, is the world warmer over the last 200 years, since the Industrial Revolution started? Yes, but it has squat to do with industry. That just happens to co-incide with the smallest sunspot activity in “modern” times.
Eventually the world started to warm again. From 1890 to 1934 central Europe barely saw any snow. Another warm spell from 1942 to 1953 had scientists predicting the death of Europe’s glaciers, a forecast invalidated when the world once again cooled.
Here’s some interesting data as we get closer to the present day:
1. Temps continued to fall from 1953 until the mid-1970s – despite rising CO2 levels. This was during the single most industrializing time on earth—and temperatures fell while CO2 levels rose.
2. Another point: if CO2 emissions cause global warming the layer of the atmosphere 5 to 10 km (3-6 miles) above the earth where CO2 interacts with sunlight should be warming more quickly than the earth’s surface. In fact, temperatures at these levels have been unchanged since accurate balloon measurements became available 50 years ago.
3. There has been a large outcry about the decline of Arctic Ice. While Arctic sea ice extent is just above average levels, Arctic sea ice is near record thickness: the volume of ice in the Arctic last fall was 50% higher than 12 months prior, following a very cold summer in 2013 in which temps climbed above freezing only 45 days compared to an average of 90 days.
I bet you didn’t read about that.
4. There’s a lot of ice at the other end of the globe too. In eight of the last ten years global sea ice extent has bested the 30-year average, aided by an Antarctic sheet that in October hit its highest extent since record keeping started in 1979.
5. The Northern Hemisphere had its second, third, and fourth highest snow extents on modern record in 2010, 2011, and 2013. In the United States 2013 brought the largest year-over-year drop in temperature on record and the winter is on track to be labeled the third coldest in 200 years.
Evidence of this cooling is everywhere – even if politicians and the media try to pretend it isn’t. Of course, the media has short memories. Only 40 years ago, in mid-1974 Time magazine ran a cover story entitled “Another Ice Age?” noting a 12% increase in New Hampshire snow cover in 30 years.
Conclusion: over the last 1,200 years the earth has been through several pretty extreme temperature swings. What gives?
The answer lies with the sun. Cold periods coincide with solar minimums, which generally happen every 150 to 200 years. Warm periods coincide with solar maxima, which happen every 700 years or so.
In Part II, you will read about how accurately sunspot activity relates to earth’s temperatures, why the signs are indicating a deep cooling trend for the next 20 years (brrrrrr……), and one near term investment idea in the energy patch that should prosper greatly from this new trend.


