Duvernay Oil Companies: The Stocks To Emerge the Winners

0

by +Keith Schaefer

Last week I looked at breaking developments that suggest the Duvernay shale may be the most profitable play in Canadian history.

Consider just two points on the play—hot off the press at a tight-knit gathering of Duvernay insiders put on by TD Securities in Toronto a few weeks ago:

  • Well costs all-in are probably running $10 to $15 million right now—with most producers agreeing that $12 million is likely, going forward.
  • EnCana’s (ECA-TSX) recently-completed 8-5 well generated $9 million in cash flow in under six months.
  • Athabasca Oil’s (ATH-TSX) 2-34 has pumped $11 million in cash flow in just eight months (see graph of production from TD below).

Duvernay Oil Production


Incredibly, those figures make the one-year payouts predicted by Duvernay operators like Chevron (CVX-NYSE) and Trilogy (TET-TSX) look conservative.

Numbers like this are creating a lot of excitement.

Like the Viking oil play in 2012, fat returns from drilling here may be setting the stage for a big round of M&A in this acreage—to the tune of millions or even billions of dollars. We’ve already seen that international plays are willing to put up that kind of money for Canadian shales—just look at Progress/Petronas paying $1.5 billion this month for Talisman’s (TLM-TSX) Montney land package.

The question is: which companies are best-positioned to benefit from Duvernay profits?

A Sneak Peak At Financial Returns

There’s two parts to this. Firstly—who’s drilling right now and starting to get a bump from Duvernay production in their cash flow numbers? Then—who has the land holdings to scale drilling out and offer the kind of “factory” that incoming majors want?

In terms of financial results, it’s still early days for the play. You’d expect drilling results to start having a material, bottom-line effect only for the smallest, least-diversified juniors here—the ones most exposed to Duvernay production.

The company that fits this bill is Yoho Resources (YO-TSX Venture). This small developer today gets about 30% of its overall production from the Duvernay.

Financials from Yoho are thus an important indication about Duvernay profitability. And so far they look pretty good.

In 2012, the company spent just under $35 million in the field and added about $58 million in proven and probable reserves. Overall, each dollar spent created about $1.70 in 2P reserves value. That’s very good—not quite the 140% returns some analysts have modeled for the Duvernay, but we may not be fully seeing yet the effect of recent wells.

Other, bigger players in the Duvernay like Athabasca Oil (TSX: ATH) and Trilogy Energy (TSX: TET) have yet to show much bump in profitability from their drilling here. Both companies saw returns on their invested capital in 2012 come in negative (victims of the higher costs that are hampering the industry).

But these firms may simply need more time for the Duvernay to trickle through to their bottom line. Both have significant operations outside of the play, which are likely affecting their stats. And a lot of their best Duvernay wells have been drilled only during the past year—we’ll need to look at the new reserves evaluations that come out early in 2014.

The Leaders in the Land Rush

But let’s assume for the moment that phenomenal early drilling results like the ones mentioned above are going to make the Duvernay a profitable play. Which companies have the land positions to develop it at scale?

The chart below from TD shows the top 10 Duvernay land holders. These holdings span three different core areas in Alberta for the Duvernay—from north to south, Kaybob, Edson and Willesden Green. Locations are shown in the map from TD. These land holdings are dominated by majors—with the smaller end represented by Athabasca, Vermillion (TSX-VET) and Trilogy.


duvernay land holders


Duvernay Oil - Geology Map


But it’s obvious from the map above that not all acreage is equal. The thickness of the Duvernay (what geo-wonks call the “isopach”) is much greater in the Kaybob area than the other cores (the purple sections are the thickest). Companies drilling in Kaybob get up to 30 metres more shale pay than those in Edson and Willesden.

One key factor appears to be making the difference: natural gas liquids.

That’s important because liquids are the main driver for gas drilling in North America today. They are why producers can still make a profit at $3/mcf gas in Canada.

For the Duvernay, liquids are especially critical—because the play produces mainly high-value condensate, which right now in Canada sells for a 10% premium to crude oil.

This condensate output is the key to the Duvernay’s outstanding well economics. The Athabasca 2-34 well that cash flowed $11 million in 8 months has seen average condensate production of 377 b/d. The big EnCana 8-5 well is the best liquids producer so far drilled in the play (at least that we know about), at 501 b/d of condensate.

Both of these wells were drilled in the Kaybob area—where EnCana and Athabasca are focused. Liquids production here looks to be significantly higher than in the other Duvernay operating areas.

Research from Canadian brokerage boutique Peters & Co. shows that the best liquids-producing wells in the Willesden area are only doing 140 b/d—less than half of what the good Kaybob wells are putting out.

This might be why big landholders in Edson/Willesden like Penn West (TSX-PWT) are putting their acreage up for joint venture rather than drilling it themselves.

The Best Producers in the Best Part of the Play

So, who are the leaders in the liquids-rich Kaybob area then?

Again, you need to look beyond the raw acreage numbers—to see who is in the right part of Kaybob. In this case, the liquids window.

As the map below from Dundee Capital Markets shows, the Kaybob area is oil-prone to the northeast, and produces dry gas (no liquids) to the southwest. Only in the central portion (between the two dotted black lines) does the Duvernay produce liquids-rich gas. Of course, the lines are approximate—I’ve circled in blue the approximate area that’s so far seen wells with high average condensate production of a few hundred barrels per day.

Athabasca - Duvernay Map


Looking at it this way changes the picture a lot.

A big landholder like Athabasca looks great on paper—except that most of its holdings (shown in dark green above) are in the oil-prone part of the Duvernay. The jury is still out on the oil window thus far. This could prove profitable too—but the big numbers on economics we’re talking about are for liquids-rich gas wells. You have to make sure you’re comparing apples to apples.

Athabasca did have the big 2-34 gas well. But this was drilled on one of only a few sections of its land that push south into the liquids-rich window.

Exxon/Imperial have also missed the spot to some degree. Although these companies have scattered holdings in the liquids-rich window, their biggest contiguous land packages are in the dry gas part of the play.

The core of the liquids-rich acreage is really held by four companies: Chevron (dark blue), EnCana (grey), Shell (red) and Trilogy (yellow). Yoho also holds a strip of land in the right area (orange)—small in the grand scheme of things, but probably material to a company with a $150 million market cap.

While Yoho is indeed a pure play, their challenge is that they are not in the data sharing group with the majors so it’s likely they will be behind on how/what technologies are improving production and lowering costs. So capital efficiencies—the cost to bring up a barrel of oil/condensate/gas–will be poorer.

Shell and Chevron are too big to get much recognition for this play in their share price. EnCana might—maybe helping them shed their reputation as an unexciting dry gas play.

Trilogy is running quickly in the Duvernay, having drilled 11 horizontals here as of October. The company will dedicate $75 million to the play in 2013—a good chunk of its total budgeted capex of $350 million for the year.

Trilogy also holds a unique advantage when it comes to producing Duvernay liquids-rich gas. The firm has a liquids processing agreement with an extraction plant in Illinois—allowing it to ship high-liquids gas here. That means two great things–they don’t have to finance expensive separation facilities—and they accessbetter product pricing in Chicago.

This will be the company to watch to see how wells here ultimately affect the bottom line.

– Keith

The Duvernay: North America’s Most Profitable Condensate Play?

0

The Duvernay code has been cracked, and Canadian analysts are racing to update their financial models. It’s one of the biggest plays in Canada, and in a very short time it has gone from a very expensive science experiment to a money making play.

Recent results from Chevron (CVX-NYSE) and Trilogy (TET-TSX) have very recently released results showing one year payouts on $12 million wells (!!) based on strong condensate production.

“Recent results indicate IP30s have doubled, with much higher liquids yields,” says Chris Theal, Chief Investment Officer at Kootenay Capital Funds in Calgary. “I would say the rate of change in IP rates has been so significant, that investors should dismiss well data on Duvernay wells older than six months.

“The last time we saw a rate of change in productivity and efficiency this big was in the Viking oil play in the fall of 2012—which triggered a very active M&A cycle. I expect that to happen in the Duvernay now, especially in the Kaybob area.”

In the two years prior to these results, the industry had spent well over $2 billion developing the play—and there was literally just one well in the public domain, by Athabasca Oil, that gave me any reason to be excited.

But now —it could quickly turn into the Eagle Ford of Canada.

The Duvernay is a play that, when OGIB wrote about it in the summer of 2012, was so new that the jury was still out on whether it would sizzle or fizzle.

It’s now attracting some VERY big names. Chevron (NYSE: CVX) announced in late October—in a stand-alone release no less—that they completed 12 wells in the Duvernay, says this could be a world-class play.

The Duvernay is the single most important play in Canada for 2014 for two reasons:

  1. Oilfield services (OFS) spending—with LNG spending still up in the air, OFS stocks are vulnerable to a down year without Duvernay activity
  2. 200,000 bopd of new oilsands production has been announced in the last week, which means A LOT of new condensate production is needed to dilute that heavy oil to help it flow in the pipelines. (What pipelines that may be—we don’t know ;-))

And the deep Duvernay—which is still costing $11-$15 million a well—is all about condensate. Chevron reports that its Duvernay wells are producing up to 1,300 barrels per day of condensate.

That’s a huge output for liquids. High profile plays like the Eagle Ford don’t put out that much—EOG Resources’ (NYSE: EOG) average initial production rates for its Eagle Ford acreage are running about 1,225 barrels per day in 2013. And the product EOG produces is mostly crude oil.

The Duvernay produces condensate—a liquid that in Canada currently sells at a 10% premium to crude. And commands an ultra-low 5% royalty rate under Canadian rules—compared to up to 25% for condensate from the Eagle Ford or Marcellus.

Why is this happening now? From the press releases and research I’m reading, there really is no special magic bullet here—the code is being cracked by the same ways other formations are increasing production—by:

  1. using slickwater fracks vs. oil fracks,
  2. using more intense, tightly spaced fracks that used more frack sand per frack,
  3. longer horizontals—2 km or more

Several Canadian brokerage firms have issued big updated reports on the Duvernay recently—Dundee Securities, TD Securities and boutique Peters & Co. The Dundee report shows some strong Duvernay economics—think triple-digit profitability.

Here’s how it breaks down.

The analysts estimate that in the “Tier 1” areas of the Duvernay, a $12 million well will initially produce at over 1,100 barrels of oil equivalent per day (judging from Chevron’s numbers, rates may end up even higher). The total production over the well’s life will approach 1 million BOE.

The real kicker in terms of value is that 60% of the output is oil and natural gas liquids like condensate. Depending on production rates and gas prices, the net present value of one of these wells ranges from $8 million to as high as $27 million.

The most eye-catching finding from Dundee is the return on investment from drilling here.

The analysts calculate that the average internal rate of return on wells in Tier 1 areas of the play is 142%. Triple digits?

That kind of payback on capital would put the Duvernay as the most profitable play in Canada—and possibly in all of North America.


duvernay payback data


Land prices for Duvernay rights are reflecting these profit metrics. A recent analysis from TD Securities shows that Duvernay acreages seem to be tracking the same escalating path seen the last few years in hot areas like the Eagle Ford and Bakken.

Note the rapidly rising land price trend in the chart below from TD (Duvernay sales are the green triangles). Prices here look to be going up even quicker than their high-profile U.S. counterparts did.
duvernay comparison - eagle ford


One of the most revealing things about the Duvernay potential is who is doing the drilling today. As the chart below from Peters & Co. shows, the torch has firmly passed from the juniors who pioneered the play to majors and super-majors. Today it is Shell, EnCana, Chevron and XTO who are leading the charge with the drillbit.

duvernay wells drilled


The liquids-richness of the Duvernay is almost certainly the big thing attracting these large firms to the play. That’s the kind of “kicker” majors are looking for in today’s depressed North American gas market. In fact, prolific condensate production from the Duvernay may be coming at a perfect time, in a perfect place.

That’s because one of the major uses for condensate in Canada is for diluent in pipeline transport of heavy oil. That demand is only getting bigger. Look at developments like Suncor’s Fort Hills oil sands project. Last week the company announced a positive production decision on the 3.3 billion-barrel project. Plays like this are going to add a lot of heavy oil supply to pipelines over the next several years—and need a lot of condensate for diluent.

The chart below from TD shows the potential scale of growing diluent demand in western Canada. Diluent requirements (the top, purple line) have surged 50% the last few years—and projections suggest that’s just the beginning.


duvernay diluent demand


That growing demand should mean strong condensate pricing in Alberta. And great economics for Duvernay wells like Chevron is reporting.

Yes, condensate supply is going to grow—possibly by several hundred thousand barrels a day. That would represent a big jump from the ~125,000 b/d of condensate that Alberta currently produces. Demand for diluent is strong—currently running over 300,000 b/d.

And this need is expected to grow to over 900,000 b/d by 2022 as more oil sands projects come online. The chart below from Alberta Energy Regulator shows a notable and growing gap between condensate supply and demand.

Duvernay - Alberta Gas and Condensate Demand


That should be enough demand to keep prices relatively buoyant…

Perhaps not at the lofty levels producers are enjoying today—but enough that Duvernay wells will still be turning a decent profit.

+Keith Schaefer


Digging Deeper into the Bakken: The Three Forks Oil Formation

0

One year ago, I wrote this story, asking—could the Bakken ever hit 1 million barrels of oil per day (bopd) production?

Well, now the Market is asking—when (not if) will it hit 2 million?

A massive, 76-page report from Goldman Sachs from late September suggests 2023—that’s another TEN YEARS of growth—with the biggest growth year being next year, in 2014.

In fact, they say the worst case scenario for the Bakken is now 1.3 million in 2017. One million? Pfffftttt…yesterday’s news.

A smaller examination from Credit Suisse in early October suggests the same thing. Analysts from these investment giants went to the Bakken to find out firsthand whether this prime play has peaked.

And the two groups independently returned with the same answer: no.

Two factors will continue to drive Bakken production growth for at least another decade: tighter well spacing and production from deeper zones. There’s enough life in these drivers that Goldman’s analysts started off their Big Report by stating they “believe production from the Bakken horizontal oil shale play in North Dakota and Montana can continue to grow substantially.”

If deeper zones and tighter well spacing were not spurring resource expansion, Bakken oil production would plateau at 1.3 million bpd in 2017. That would mean the Bakken only offered a few more years of growth, and at a much slower pace than we have seen to date.

Instead, Goldman expects the Bakken to peak at 2 million bpd and not until 2023. To get there, they figure production growth will average 130,000-210,000 bopd a year, well above the 110,000 bopd increase that we saw in the first half of this year.

North Dakota Oil Production DNRC


Their reasoning goes something like this.

First, the play has been de-risked and its areal extent defined. Bakken operators now known where and what the Bakken is.

However, they are still figuring out how well spacing and drilling depths impact everything, like how much oil they can pull from the formation.

At first, producers drilled Bakken wells on 640-acre spacing, one per square mile. Then they moved with good success to 320-acre spacing. With shale formations, the worry is that wells drilled too close together tap into the same oil and limit each other’s productivity. (The industry says that wells are communicating.) However, this year operators started to test 160-acre spacing – and met with great success in some areas.

Not every part of the Bakken will be able to support 160-acre well spacing, but the analysts at Goldman figure 20% of the Bakken can handle it. They also think downspacing, as it is known, will get seriously underway in the next six months because lots of Bakken E&Ps are testing tighter spacings now.

Second, Goldman sees production rising as producers tap into deeper reserves. The Bakken is a layer cake, with five oil-bearing layers amongst nine total layers. The top two oily layers, the Middle Bakken and Three Forks 1, currently account for most of the Bakken’s production.

Underneath these layers lie three more oil-bearing shale formations, known as Three Forks 2, 3, and 4. So far wells drilled into these deeper layers have been mostly exploratory, but there have been some successes, especially from Three Forks 2. This bodes well for at least some deeper Bakken production.

On top of all that potential for production growth, the Bakken is also becoming more efficient. Better geologic understanding and more experienced drillers mean well costs and timelines are both coming down.

Slow output growth in H1 2013 but different drivers to come

Bakken production growth did slow notably in the first half of 2013—Goldman says that was due to weather issues, and the timing of bringing pads online.

As the Bakken matures more operators are shifting to multi-well pads, which take longer to establish but are more efficient in the long run. This transition really hit in H1 ‘13, which means the slowdown in output growth was really just a delay.

As all those multi-well pads come online, all that delayed output will boost Bakken production once again – with the biggest boost coming next year, when the guys at Goldman expect Bakken oil production to climb 212,000 bpd. After that they foresee output growth of 165,000 bpd in 2015 and 115,000 bpd on average in 2016-2018.

Efficiency, not rig count, is what matters

Production growth in the Bakken is still happening, despite fewer wells being drilled. Rig counts are used to measure how busy a play is and a declining number added to concerns the Bakken boom was ending.

What makes rigs more efficient? Well trained crews. Experience–operators now understand their acreages and geology better, and so can spot wells more accurately. Small technical improvements like better fluids and drilling technology means wells get drilled more quickly and the rigs can move on to the next job sooner, reducing the needed number of drills.

Fewer rigs does not mean fewer wells. Goldman forecasts well completions will also rise even as the rig count declines, with faster drilling times. They see 20% more wells drilled in 2013-2017 compared to 2011-12, even assuming a 20% lower rig count.

And pad drilling is starting to happen in the Bakken—where the industry drills 8-10 wells from one 10 acre site. This requires fewer rigs to complete the same number of wells.

Goldman sees no end to this trend. In fact, their analysts predict an average of just 150 rigs in 2014 through 2017, down from a peak of 213 in mid-2012, even as Bakken production climbs from just over 700,000 bpd today to an estimated 1.6 million bpd in 2017.

A more accurate measure isn’t the number of rigs drilling, but the number of feet that get drilled. A lot of operators are now doing two mile plus laterals—longer than ever before. That reduces the rig count as well.

Credit Suisse adds that these longer laterals—with more fracks spaced more tightly together—are boosting recoveries, and with not much added cost. These analysts say companies in the core of the Bakken are now guessing they will recover as much as 940 million barrels of oil equivalent (mboe), compared with 650 million boe in 2012.

So a smaller rig count is simply a result of a better, more efficient Bakken – not, as the Street worries, because of lack of inventory.

Digging into those deeper zones

Most horizontal drilling activity in the Bakken has focused on the Middle Bakken, a limestone, dolomite, siltstone and sandstone layer that lies about 4,500 feet below surface on the eastern edge of the basin, deepening to 11,000 feet below surface in the southwest corner of North Dakota.

The source rock for the Middle Bakken – the part of the formation that supplied the oil now in the Middle zone – are the Upper Bakken shale, a 23-foot thick layer just above the Middle Bakken, and the Lower Bakken Shale, a 50-foot thick formation just below.

The Three Forks formation is beneath all of that. This 250-foot thick section has 4 different layers, all of which also got their oil from the Lower Bakken Shale. The uppermost Three Forks layer (Three Forks 1, or TF10) has been largely derisked – in other words, it is producing.

bakken oil - three forks production data


Three Forks 2, 3, and 4 are still largely exploratory.

Three Forks 2 (TF2) is certainly showing promise, though primarily in McKenzie County, in the core of the Bakken. Continental, ConocoPhillips, and EOG have all drilled successful TF2 wells in McKenzie County.

There have also been successful TF3 wells, and while the numbers are fewer the geographic spread is greater. Operators have reported successful TF3 wells in four different counties.

The sector is still waiting for a strong TF4 well. Only two TF4 wells have been drilled to date, both by Continental, and neither well produced economically

A key question is whether Three Forks 2, 3, and 4 can be developed independent of TF1. It is possible that wells drilled into the Middle Bakken and Three Forks 1 may have depleted the Lower Three Forks interval.

In short, the data is still limited and key questions remain unanswered. Nevertheless, Goldman assumes 25% of the Bakken will generate some productivity from Three Forks 2, 3, and 4. That can only help.

And of course, this report was written before Whiting Petroleum (WLL-NYSE) and EOG Resources (EOG-NYSE) showed the Market in early October that they can greatly increase the EUR of a Bakken well by using short wide fracks vs. long skinny ones—you can read my story on that HERE.

So it’s possible late 2014 I’m writing a story…the Bakken only producing 2 million barrels a day? Pffffttt…that’s old news.

+Keith Schaefer


A Simple New Fracking Technique that Could Revolutionize the Oil Sector

0

I want to tell you about a new development in fracking that’s getting some press down in the US. This is actually pretty simple, but if I’m correct in interpreting this, it would be quite important in the global oil patch.

From what I can tell, EOG Resources is increasing IP rates in the Bakken simply by changing the way they frack—from long skinny fracks into formations, into wide short ones that stay much closer to the well bore. And–this is the important part—they say first-year decline rates are going down a lot, and total oil recovered is going up a lot.

In doing the shorter, wider fracks, they use a lot more sand and water to create more rock face/surface to liberate more oil from the stock.

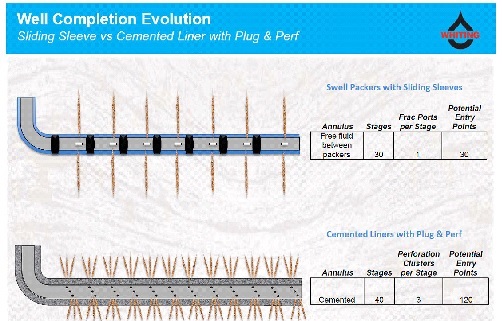
One of the other companies to evidently first use this method is Whiting (WLL-NYSE), and this slide comes from their powerpoint that visually shows what I’m trying to say:


well


“In the next five years, everybody is going to be doing this,” says author Michael Filloon, who wrote about this very simple new fracking strategy recently at www.SeekingAlpha.com.  It was the first story I’ve seen anywhere on this issue.  “I think it will work in every play in the US,” he adds.

Filloon got onto the story after noticing EOG was handily beating quarterly expectations (they sure have a great stock chart!) and yet there was no conclusive talk from management on the quarterly conference calls to explain why.

So Filloon went online into the North Dakota public data on EOG’s wells and plotted the data himself, working backward to figure out IP rates and decline rates.  It was great investigative reporting. (You should all follow Michael at SeekingAlpha!)

His story—link below—is a little technical, but the charts he uses shows the depletion rates for wells getting lower—meaning the high initial production doesn’t fall off a cliff like the industry has become used to.

There aren’t a lot of data points yet, and they are almost all from EOG, (though supported by the Whiting presentation above which came out at a JP Morgan conference recently) but they point to larger IP rates and lower declines using a wider, shallower frack that uses a lot more sand (called proppant, as it props open the frack pores) and water.

Here’s the story:

http://seekingalpha.com/article/1755982-bakken-update-frac-sand-pricing-could-go-parabolic-as-eog-resources-well-design-revolutionizes-unconventional-oil-production

EOG is showing some BIG jumps in the EUR of their Bakken wells in their powerpoint.  EUR stands for Estimated Ultimate Recovery—how much oil they actually expect to get out of their wells.”Some of these wells have EURs of two million barrels of oil equivalent–that’s unheard of,” says Filloon.

At the same time, EOG is showing that well costs are coming down.

If it’s all true…what does this mean?  Well, the data is suggesting this could greatly reduce the initial hyperbolic decline in tight oil in North America. 

In other words, these wells would produce stronger for longer out of the gate, and recover a lot more oil than before.

That would be big—NO, it would be huge.

That speaks directly to my recent story, which showed cash flows are expanding per boe for producers now—so they can weather a drop in the oil price and likely have steady cash flow.

It almost sounds too good to be true, except the Bakken stocks and frack sand stocks took off at the same time in mid-August.  Interesting.

It should mean more production per well, more oil. More supply should mean lower oil prices.

That’s good for refiners, but of course gasoline prices will fall too—but likely not as much as it’s allowed to be exported.

I would also think this is good news for drillers and frackers—more wells can be drilled per square mile if they are just short fracks—”downspacing,” the industry calls it.

It has already been great news for the frack sand companies—Filloon pointed to the charts of SLCA, HLCP and EMES as public frack sand stocks that have skyrocketed in the last two months.

The big producers in the US who have efficiencies of scale—and work 24/7 now should benefit from this as well.

Again, this is one story on one idea, but I find it really intriguing.  It might be true! And if it is, the fast-growing North American oil production would gain another gear—or three.


The Bakken Oil Formation’s Breakout Play: Triangle Petroleum

0

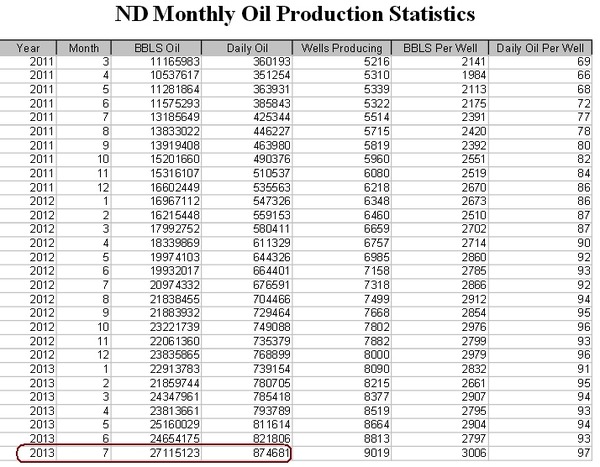
North Dakota did it again. July oil production numbers for the state was another record high—and it was a BIG one.

Monthly stats from the EIA (US Energy Information Administration) showed North Dakota production jumping by a whopping 55,000 barrels per day in July to reach nearly 875,000 barrels per day.

North Dakota monthly oil production

source: http://4.bp.blogspot.com/-X_OUXH7gOdw/UjdTG5RoJsI/AAAAAAAApWA/ndi_fErzjNk/s1600/NDoilJuly2013.png

This was one of the largest monthly increases that the Bakken has seen! Two factors caused this jump.

First, wet weather had been holding back the completion (read: fracking) of wells for several months and a dry month of July allowed producers to quickly do some catch up.

Second, producers keep getting more and more efficient with the wells they are drilling so when they are able to also get those wells quickly on production it makes a big difference.

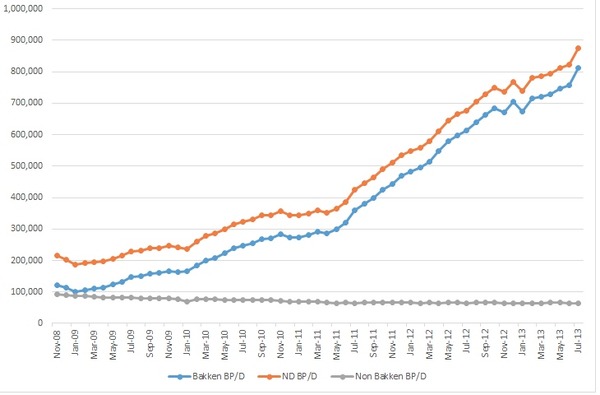
The incredible boom that is the Bakken oil story continues to roll along.  At the end of 2012, I wrote a story on:  When will the Bakken peak?  (You can read it here).  For now, it looks like the answer is—a long way off.

bakken oil production


http://peakoilbarrel.com/wp-content/uploads/2013/09/Bakken-Barrels-Per-Day.png

While production from the Bakken continues to set new highs every quarter, the performance of share prices of Bakken focused producers have been nothing to write home about.  In fact, they just started to move in September, after two years of trading flat.

After taking an interest in these companies in 2009 and 2010 the market has not been giving these companies much love, despite continued production growth.

Part of the problem has been concerns over the discounted price that many of these producers had been getting for their oil as a result of the oil logjam at Cushing.

Then producers started moving crude by rail—all over the US.  The Bakken oil discount went away, but strangely, just as these stocks are starting to move up, the discount has widened again…though not to what it was.

That hasn’t stopped money flowing back into Bakken producers.

That makes sense to me, as these companies offer very simple, and very compelling stories.   These companies are in a great position where all they have to do is go out and “drill what they already have.”

No exploration, no big money to be spent on acreage.

These companies have already locked up the key acreage in the Bakken.  Business for these companies is now all about going out and drilling these high quality, low-risk development wells in the middle of the Bakken.

These companies are less explorers for oil than they are manufacturing operations.  Now it is all about getting out in the field and drilling wells.

And the more you drill, the better you get at doing it.

With WTI oil prices just under $100, these Bakken producers are able to “mint” money and investors are starting to notice.

Triangle Petroleum – A Bakken Break-out Play

If you are looking for a way to play the Bakken, the “best in breed” pure play on the Bakken in my coverage is Triangle Petroleum.

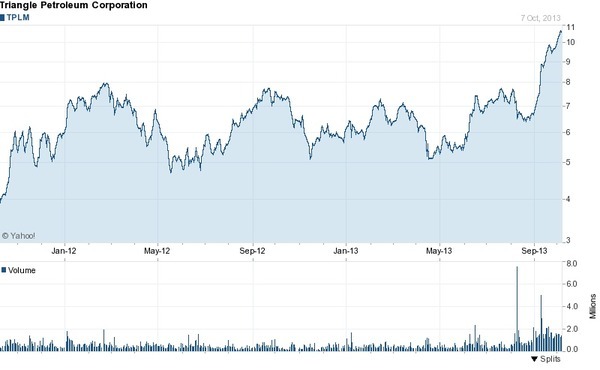
After two years of treading water Triangle’s stock price is finally starting to break out.


Triangle Petroleum TPLM

The Triangle Business Model: Still Oil and Gas

Triangle has 95,000 net acres of land in total.   45,000 of those acres are in the Williams and McKenzie counties are in the North Dakota Bakken.  The other 50,000 net acres are just across the border in Montana—on a property called the Station Prospect.

Triangle’s North Dakota properties are fairly well de-risked.  How productive and profitable the Station Prospect property will be is yet to be determined.

On August 6 Triangle announced that it had acquired an additional 9,350 net acres and 1,150 Boe/d of estimated current net production (86% operated) in McKenzie County.

This land is right beside Triangle’s existing land and increased its core McKenzie holdings to 45,000 net acres, current production to 5,650 Boe/d, and proved reserves to 22.9 million boe.

This acquisition looks like a good deal for Triangle.  Assuming that the 1,150 boe of production is worth $80,000 per flowing barrel, that means that the 9,350 acres were acquired for $1,500 per acre.

That is cheap when you consider that larger Williston basin competitor Kodiak (KOG) trades at over $14,000 per acre

In addition to those 45,000 “core” acres in McKenzie County, Triangle has 50,000 prospective acres in Montana which is known as “Station Prospect.” Activity in the Bakken is spreading northwest up into Montana, near where Station Prospect is located, which straddles Roosevelt and Sheridan counties.

The company says it has 360 operated drill locations at Station Prospect—enough to keep them busy for a few years.  The Station Prospect property is not a sure thing though as it is still unknown if profitable wells can be drilled on the property.

Vertical Integration

What makes Triangle unique is that it is the ONLY small vertically integrated Bakken player.

RockPile Energy Services is Triangle’s wholly-owned subsidiary that provides hydraulic fracking services to Triangle and third-party customers.

“Fracking” or pressure pumping is what has made it possible to produce oil and natural gas in places like the Bakken where conventional technology is ineffective.

Having its own fracking division means that Triangle doesn’t ever have to worry about a shortage of fracking services.  This is a very real concern, especially for the smaller producers.

The bigger producers like EOG or Continental Resources are huge customers for the services companies.  If there is a shortage of fracking crews and equipment it will not be these big boys who miss out, it will be the smaller companies like Triangle left out in the cold.

The bigger producers who are the service industries best customers also get first choice of the best equipment and crews.

Having its own fracking service in-house not only guarantees access to the service for Triangle but also allows the company to have much greater control over costs and the quality of the work being done.

In addition to Rockpile Energy Service, Triangle has its own Midstream subsidiary called Caliber Midstream.

Caliber is a joint venture with First Reserve Energy Infrastructure Fund (FREIF) and was created in October 2012 with Triangle contributing $30 million and FREIF $70 million.

Caliber is an energy infrastructure company that provides the following services

  • crude oil and natural gas gathering and transportation
  • water treating and processing
  • produced water transportation and disposal
  • freshwater sourcing and transportation by pipeline

Caliber benefits its customers by reducing the cost and environmental impact of trucking and also reduces or eliminates the emissions caused by natural gas flaring.

Caliber began water transportation and disposal operations in January 2013 and expects to have all business lines in service by the third quarter of fiscal year 2014.

After Two Years Of Treading Water, Triangle’s Share Price Is Moving 

Triangle’s share price took off at the start of September and it did so for a number of very good reasons.

Removal of Large Oil Differentials – The combination of oil by rail and many different pipelines being built out across North America have eliminated the wide discount between the oil being produced in the Bakken and the oil produced globally.

The market can now see clearly that the oil backlog at Cushing is being drained and is willing to believe these Bakken producers are going to receive better prices going forward.

Predictable Growth / Increased Operatorship — Triangle had experienced very choppy production growth as the company took control of its field operations.

Since the start of 2012 the company has gone from operating 0% of its production volume to operating 70% of its production volume.  That is a big and important change.

Increasing operating control is a big deal, because the market values operated production at much higher levels than it does non-operated production.

Being operator gives a company more control over its own destiny.  Operatorship provides control over the timing of spending and the quality of results.

That choppy growth has started to become smooth and predictable, the market loves that and is rewarding the company.

Triangle’s efforts to vertically integrate its operations made for some short term indigestion in pursuit of long term benefits.

Now the market is starting to see that the integration is working and the unique advantages Triangle has because of it.

Downspacing! Downspacing! Downspacing! – The 800 pound gorilla for these Bakken operators is that the play keeps getting better.   Downspacing involves drilling more wells per section of land–which increases the amount of oil that can be recovered–and therefore the value of that land.

Triangle’s recent downspacing tests indicate that the company can drill 6 to 8 Middle Bakken wells per 1,280 acres (2 sections, or 2 square miles) spacing unit with “no communication.”   What that means is that Triangle has found that adding more wells does not lessen the amount of oil that can be produced by the original wells.

While it is still early days, it does look like Triangle could drill twice as many wells and recover twice as much oil than it expected to from its core acreage in Mackenzie County.

Montana (Station Prospect) Looking Interesting — Things are starting to get interesting in Montana as the industry has been drilling all around Triangle.  Companies that have drilled wells in the area include Continental Resources (CLR), Southwestern Energy (SWN), Whiting Petroleum (WLL) and Samson Oil and Gas (SSN).

All Triangle needs to do is sit and wait for one of those companies to reveal that they have “cracked the code” on the play.  Once someone figures out how to drill profitable wells, the play goes from just having potential to being the real deal.  Acreage land values will then increase by multiples of current prices.

The Bakken Just Keeps Getting Better

For two years the stock market has not been focused on just how good things are going in the Bakken for Triangle and other operators.

These companies are seeing almost every aspect of their businesses improving:

  • Production is up
  • Costs per well are coming down
  • Wells are being drilled faster
  • Wells are being drilled more efficiently
  • Estimated recoveries per well (EURs) are increasing
  • Estimated recoveries per section are increasing through downspacing
It looks like the market is now waking up to what these companies have to offer.
With oil prices just under $100 per barrel, the Bakken is going to keep on booming, and so too should stock prices for Triangle and its competitors.

+Keith Schaefer

These 2 Trends Are Bullish for Energy Investors

0

There are a couple trends here everyone should be aware of—and it’s all good news for energy investors.

THEME #1—DROP IN OIL PRICES MAY COME BUT NOT IN CASH FLOW

First—the stocks of the major independent producers in the US like EOG (EOG-NYSE) and Pioneer (PXD-NYSE) have had great runs this year—and all year. Some of the intermediates have had great runs in their own, one-play fields—like Goodrich (GDP-NYSE) in the Tuscaloosa, Matador (MTDR-NYSE) in the Permian… and pretty well allthe Bakken stocks now. The Bakken stocks all popped in August, and have stayed up.

So I think this trend of the market rewarding producers is coming down-market to where I spend my time—in the juniors.

Well costs are coming down in the US oilpatch and IP rates are going up. With some of the US plays able to hold 8-16 wells per pad and crews now working 24/7, and continued fracking improvements—costs per boe (barrel of oil equivalent) are coming down.

Rusty Braziel at RBN Energy had some interesting stats in his free daily blog (a great FREE resource—sign up!) on cost cutting in the US oilpatch:

oil stocks bullish trend #1
This chart comes from a story on the same theme, which you can read here:

http://www.rbnenergy.com/never-try-to-tame-a-wildcatter-changing-approaches-to-shale-production

Costs are coming down, but I think oil has some downside here—production is coming up in Libya and Iraq, and certainly in the US.

So there is easily $10 a barrel downside here, maybe more, coming in 2014. But that’s not what oil stocks are telling us in the US.

They are saying pretty loud that costs—efficiencies really, driven by both technology and scale–are coming down faster than the price of oil. In other words, don’t expect a drop in cash flow in 2014 from US producers despite an oil price drop of $10-$15 a barrel from here—or even a little more.

So really, that means get long US oil. It should outperform. I like the Bill Barrett Group (BBG-NYSE) for its Wattenberg play in Colorado (check out the chart on BCEI-NYSE, the leader in that play) and Gastar (GST-NYSE) for its exposure to Oklahoma’s Hunton oil play—and CEO Russ Porter has shown he’s a helluva dealmaker.


I don’t have the ability or the money to follow/invest in all these plays. But I think a couple other plays to watch are Goodrich—there’s only 40 million shares out and if the Tuscaloosa turns out, there’s a lot more upside than a $1.1 billion market cap.

THEME #2 – REFINERIES


The other theme here is that the WTI-Bakken spread is now out to $12.25 and the Brent Bakken spread is now about $20, making the mid-continent refineries profitable again. Many refinery stocks have seen solid share price increases, as crack spreads have improved…see this mid continent crack spread chart below, for reference:

oil stocks trend #2: price chart
Notice how this mid-con crack spread chart has a beautiful double bottom.

Keep in mind, when I bought my top refinery stock in the OGIB portfolio last August, it was on the premise that surging shale oil production would overwhelm the light oil refinery complex in the US.

Stage 1 would be big stockpiles at Cushing.

Stage 2 would just be moving that logjam down to Houston with all the new pipelines—like Keystone South—moving oil from Cushing to Houston. I thought that would have happened by now.

What that theory (and I would love to tell you that was an original thought…) didn’t account for was the huge success of rail moving that Cushing logjam out to the east and west coast refineries as well.

But I think we are going to start to finally see that happen…though not likely for another 9 months or so.

That can only mean light oil is going lower in the second half of 2014, and that should be very good for refineries (at the same time still being good for producers with no big drop in their cash flows). And being as the market prices things in 6-9 months in advance, the refinery stocks are doing that now.


So I think I can buy any of these refineries with limited downside now, though understanding that one more really bad quarter has yet to be reported.


Having said that, I have traded these refineries very poorly since my big win in March… when I sold pretty close to the exact top.  Goldman Sachs just yesterday morning called for the WTI-Brent spread to narrow a lot here—from current $9 roughly down to $5 as more refineries come off temporary maintenance.

But the glut of Bakken crude should keep the Bakken-Brent spread more profitable than it was in the summer when the spread—and the stocks—got crushed.  I am going to buy the refineries again; I just haven’t decided when and how much yet.

The Shale Gas Boom: The Energy Sector’s “Lie” of the Century?

0

In an exclusive interview, OGIB asks noted author Bill Powers: have investors and the general public been grossly misled about America’s energy future?

Something about America’s shale gas renaissance—and its gilded promise of previously-unthinkable U.S. energy independence—never made sense to Bill Powers.

As the author of the shale-challenging new book “Cold, Hungry and In the Dark” explains, “I never understood how shale plays could be considered a game changer. These are fields where they have low-quality, low-permeability rock. How do you come up with such big numbers on reserves and production potential?”

It would easy to write off Powers’ sentiment as blind naysaying. Except that he has the numbers to back up his skepticism—numbers that cast doubt on current estimates about shale’s bright future as America’s go-to energy source.

Through over 600 carefully-researched footnotes, Powers’ book documents numerous cases of data just not living up to the promises for shale gas.

One of the most glaring cases came in 2011, when the U.S. Energy Information Administration (EIA)—the government data-gathering arm that serves as one of the go-to sources in the energy business—published a study on “technically recoverable resources” from shale gas plays across the country. A study that would within months become a poster case for just how uncertain estimates around shale gas deliverability can be.

“EIA published an estimate of 410 trillion cubic feet [Tcf] of technically recoverable resource for the Marcellus shale play in Pennsylvania in July 2011,” recalls Powers. “To put that into perspective, EIA had estimated a total onshore resource for the entire lower 48 states of 750 Tcf. More than half of that was in the Marcellus.”

The large estimate of gas for the Marcellus created a lot of excitement. But soon attracted dissent, from some high-profile sources.

Most notably EIA’s fellow government agency, the U.S. Geological Survey (USGS). Just a month after the EIA’s Marcellus estimate was released, in August 2011, USGS put out its own projection of gas that might be won from this shale. The number was much different: just 84 trillion cubic feet of technically recoverable gas, nearly 80% less than EIA’s estimate.

“This seemed to be in direct contradiction to what the EIA said,” notes Powers. Raising suspicions that perhaps the shale “boom” may not be the American energy panacea it had been hyped up to be.

Eventually the EIA reduced its Marcellus estimates in line with the lower USGS numbers. But for Powers, the fact that such glaring errors could happen at all points to systemic problems in the way America’s most trusted source for energy data runs its calculations.

“These types of estimates are rampant because of EIA’s estimating methodology,” he says. “There are other, similar estimates out there that make no sense.”

For Powers, this all points to a simple, but game-changing conclusion: despite the shale hype, America might actually be running out of gas.

“The realization,” he says, “is that even with reduced demand this summer as compared to last year, we’ve seen more normalized storage levels. We’re seeing production flat-line on a national basis. Texas, New Mexico, Wyoming and the offshore are really starting to come down. Louisiana especially. Dropping production rates in these states will eventually overwhelm what is likely to be the production growth from newer plays like the Marcellus.”

But a chat with other industry insiders—including officials from the EIA—reveals that the agency’s estimating errors may not be as insidious as they appear. In fact, they might be unavoidable.

“We won’t really know how much gas is going to come out of a play until the last well is plugged and abandoned,” says Philip Budzik from the EIA’s Office of Petroleum, Natural Gas, & Biofuels Analysis. “There are a lot of things we simply don’t know about the true productive lifetimes of these wells.”

Budzik points out that drilling and well technology is changing so quickly that it’s very difficult to make actual forecasts about production performance. The wells of tomorrow could be very different from the wells of today in terms of costs, spacing, depth, length, production and recoverable reserves.

Faced with this difficulty, Budzik notes that the EIA (and all groups making forecasts) are very dependent on obtaining actual production data—to give them a gauge of what is happening in the field.

But getting such data can be easier said than done. “States like Pennsylvania only release cumulative production data every six months,” he says. Making estimation here more problematic than for other states that publish monthly data. Perhaps why Pennsylvania’s Marcellus play could become the subject of such divergent forecasts from the EIA and the USGS.

Experts at respected energy analysis shop Bentek Energy agree that state production data is critical to forecasting. “In general, estimating current and historical production is a dash of art sprinkled primarily on science,” says Jack Weixel, director of energy analysis at Bentek. “Bentek, IHS, Wood Mac, PIRA all have their own secret sauce, but the main ingredient is that well data.”

Powers also agrees that a lack of good data is a big obstacle to understanding exactly what’s happening in some of America’s biggest shale plays. “Pennsylvania falls into that category,” he says. “Other states such as Colorado, Utah and Arkansas fall into that category, so there can be very big disconnects.”

He proposes a simple solution—collect better data. Everywhere, every day.

“We should be using wireless metering in pipelines at the point of transfer from the producer to the interstate pipeline company,” he suggests. “This is off-the-shelf technology that gives an accurate reading of production data without being overly costly.”

Energy investors appear to favor Powers’ approach—with sophisticated market players today using data from private analysts like Bentek to make their decision about markets. “Bentek sees more than 90% of production on a daily basis,” says Tony Scott, the group’s Manager of Oil & Consulting Services. “So the market sees this before the EIA report and prices in any changes in the production numbers.”

But lessons from Powers and others like him are critical for those numerous investors who still key their decisions off weekly supply and storage reports from groups like EIA. Even the people who produce these numbers acknowledge that such forecasts have big limitations. Especially during times of rapid change like we’re seeing today in America’s oil patch.

Spotting investable energy trends these days means doing a lot of digging. Not just taking one or two data points as gospel on where oil and gas are headed.

As the old adage goes, “If it seems too easy, it just might be.”

– Dave Forest, guest editor


The Tuscaloosa Marine Shale: America’s Next “Hot Money” Oil Play?

0

You know what makes the Bakken oil play so special? It is oily AND over-pressured. All that means is that at a certain depth, there is more pressure than normally should be there—because there’s fluid there.

If that fluid is oil—it’s trapped—then it’s bursting to get out. It sure makes for great flow rates to get the Market excited.

And that’s what is making the new Tuscaloosa Marine Shale (TMS) in Louisiana one very intriguing tight oil play in the US.

You look around at almost all the other places in the US that produce oil, and they are either oily OR overpressured. Some parts of the Permian have both. But it’s not that usual.

If a tight oil play is surrounded by impermeable rock deep underground, the oil and gas can’t go anywhere—it just sits there under huge and building pressures. Sometimes the oil and gas can migrate a bit, but still be under huge pressures.
When they first get drilled and fracked, they can produce some BIG flow rates.

The other thing very impressive about the TMS? It covers at least 2.7 million acres just in Louisiana, and stretches into southwest Mississippi.

(And like every other big tight oil play out there, there’s an independent study that says it has billions of barrels of oil. The TMS study says 7 billion barrels, but hey, that was 1997. There’s probably a lot more since then. ;-))

The last, single most impressive thing about the TMS—it’s proven. There are several wells with over 1000 bopd IP rates. Goodrich Petroleum (GDP-NYSE) has already run from $12-$27 on this play. Sanchez has gone from $17-$27 on this play.


Tuscaloosa IP rates--Sanchez


tuscaloosa oil louisiana


BACKGROUND

The TMS is the source rock for the lower Tuscaloosa Sandstone and Austin Chalk formations which have produced oil for decades. Like most horizontal plays, the industry has long known the oil existed in the TMS. The mystery was how to get it out economically.

The TMS exists between the upper and lower units of the Tuscaloosa formation, which has been the source of conventional oil production in the area for decades for the “Tuscaloosa Trend.”

During conventional vertical well development of the “Tuscaloosa Trend,” the TMS was viewed as nothing more than a nuisance zone that slowed drilling on the way to the lower Tuscaloosa.

Occasionally, though, it did show some oil when the drill bit passed through it which put the TMS on the radar of a few geoscientists who were long-term dreamers.

The TMS attracted some more attention in 1997 when Louisiana State University’s Basin Research Institute released a study estimating that 7 billion barrels of oil lay in place awaiting recovery.

BENEFITS AND CHALLENGES OF THE TMS

Like the Bakken and Eagle Ford before it, horizontal drilling, multi-stage fracturing and some serious trial and error now appear set to release some of that giant oil prize.

The Cretaceous-age TMS is big. It covers at least 2.7 million acres in Louisiana and crosses into southwestern Mississippi.

And like I said up top, it’s important to note the TMS is not a “combo” play that is a mix of oil and natural gas or condensate production.

This is an oil play—and there aren’t many of them.

Early wells have shown production to be weighted 90% to 95% light oil.

The TMS is being targeted at depths of 11,000 to 13,000 feet, where the rocks have a thickness of 100 to 250 feet.

The play is extremely overpressured (0.70 psi/ft versus a more typical ~0.45 psi/ft), which results in high oil saturations and helps to naturally lift the oil up the wellbore. The upside is BIG flow rates.

The downside is that it makes wells more expensive.

But I think the TMS play has several advantages that outweigh cost.

One advantage is its location–Louisiana and Mississippi have a large amount of infrastructure already in place. The region already has pipelines, refining capabilities and people with experience in the industry. That reduces development costs.

And there is no severance tax on hydrocarbons recovered using horizontal wells in Louisiana or Mississippi for two years or until the producer recovers their costs of the well–that sure helps economics.

A third is how close it is to the St. James terminal located on the Gulf Coast of Louisiana. Oil sold to the St. James terminal has received a premium to WTI which reached $10 to $20 in 2012. That premium has since shrunk, but could return if pipeline and rail infrastructure can’t keep up with the pace of production growth.

And I keep coming back to this–fourth, this is very “oily” production. Wells drilled so far in the TMS are 90% to 95% black sweet oil. And that 5% associated gas has a high BTU content with approximately 80 to 100 barrels of NGLs per million cubic feet produced.

While the TMS has been compared favorably to the Eagle Ford, the play is deeper and therefore has more expensive wells—the Big Negative. The oily part of the Eagle Ford is 5,000 to 10,000 feet deep, and wells cost $7 to $8 million.

Meanwhile, wells targeting the TMS which is at depths of 11,000 to 13,000 feet, costs for single wells are running at $13 million and higher.

That means that for the TMS to match the economics of the Eagle Ford, either well costs have to come down or production has to outperform.

Goodrich Petroleum (GDP) believes that the cost per well could be shaved down from $13 million for a single well to closer to $10 million if a full development drilling program was to be rolled out. A full development plan brings with it economies of scale and improvements in drilling efficiency through experience.

Goodrich’s competitor Halcon Resources also believes that a well cost of $10 million is a reasonable target that could be achieved.

Both Goodrich and Halcon are operators with considerable experience in the Eagle Ford and have a good idea of gains that can be made as drillers become more experienced with a play and more efficient.

Assuming a base case type curve that allows for 600,000 BOE (barrels of oil equivalent) to be recovered (that’a the EUR–the Estimated Ultimate Recovery) and a $10 million well cost, a TMS well has an IRR of 75% (at $100 WTI). At a high case type curve that predicts 800,000 BOE will be recovered the IRR jumps to 156%. That’s a little bit bigger than the Bakken.

In its last quarterly conference call Goodrich Petroleum indicated that its recent Crosby well had produced in excess of 100,000 barrels equivalent in 5 months, and that it is still producing approximately 375 BOE per day at the end of 6 months of production.

According to Goodrich, plotting that 375 BOE per day of production on their 800,000-barrel equivalent “high case” type curve at the 6 month point puts them above the curve.

That is encouraging obviously as that well would be considered very economic.

But it is just one well.

Normally that wouldn’t get me too excited.

But there is more than just one well. Several operators have hit strong wells–so the industry has a bit of tweaking to do, but they have already “cracked the nut” on this play; they know how to produce from it.

Goodrich which has a market capitalization of under $900 million just acquired an additional 185,000 acres in the TMS. That is a big commitment for a company of this size. They now have 300,000 net acres.

The other big player in the TMS? Canada’s Encana (ECA-NYSE/TSX)—the 5th largest natural gas producer in the US. The wells they are drilling and operating actually have the best IP rates I see in the TMS. (I own ECA)

Sanchez Energy (SN-NYSE) just spent $78 million to get what I calculate from a complicated press release to be 40,000 net acres—or just under $2000 an acre.

Conclusion—deeper wells mean more expensive wells, but that can also mean higher EURs to compensate for that.

And infrastructure is in place and being close to the Gulf Coast Refinery Complex means lower transport costs and for now high pricing.

The Bakken in North Dakota and the Cline Shale in Texas have been the “hot money” oil plays in the US (the Eagle Ford is more gassy), and the TMS could be the 2014 play.

Privacy Overview

This website uses cookies so that we can provide you with the best user experience possible. Cookie information is stored in your browser and performs functions such as recognising you when you return to our website and helping our team to understand which sections of the website you find most interesting and useful.