Nanotechnology Hits the Oilpatch

0

Dropping energy prices—for both oil and natural gas—has investors and analysts checking to see what the break-even price is for oil production in each play in North America.

This is a moving target, and it’s going lower all the time.

And I’m going to tell you The Next Phase of increasing profitability—i.e. lower break-even costs—for the industry.

Now, the #1 reason is for lower break-even costs is better fracking techniques. The industry has not yet found the upper limits of how much oil or gas they can get out from under a square mile patch of land.

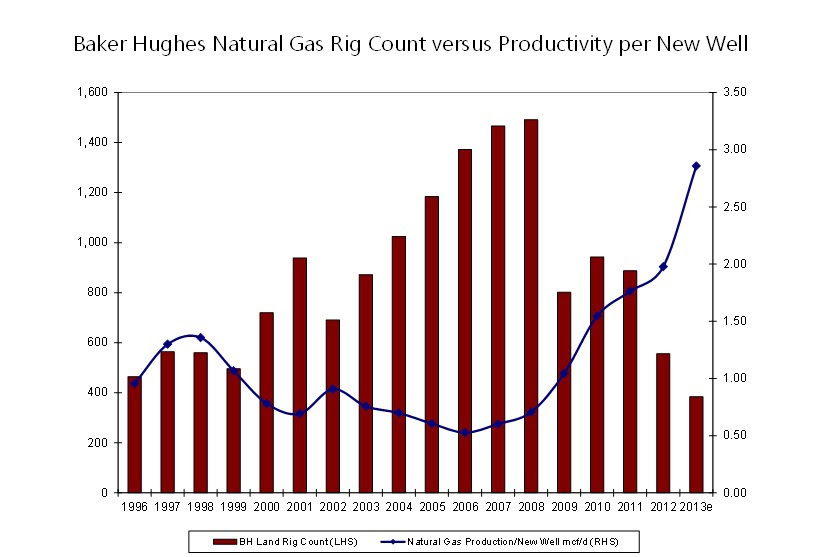
Improvements or increased efficiencies aren’t happening every year; they’re not happening every quarter, they are happening every MONTH—as this graph illustrates:

Baker hughes


Source: EIA and Unit Economics

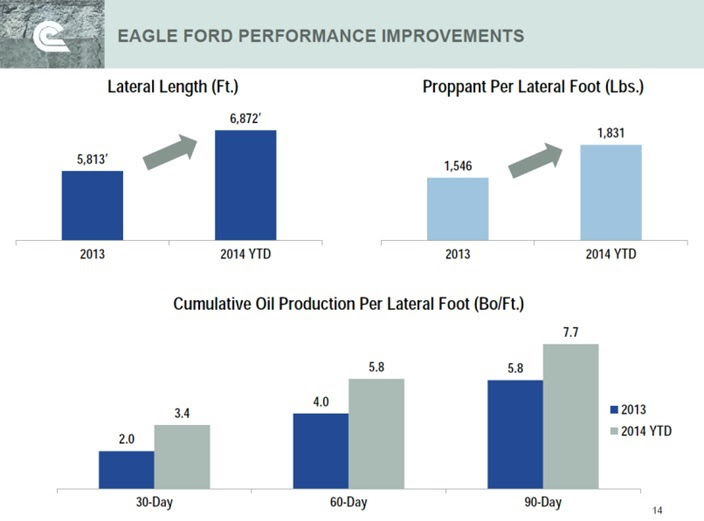
Here’s another graph that shows how oil production is improving in the Eagle Ford. Drilling longer wells and putting more frac sand in wells is increasing flow rates from wells on a per-foot basis.

eagle ford


So while commodity prices are dropping a lot—cash flows won’t be going down by the same amount. (And in Canada, energy prices have barely budged when you count the lower Canadian dollar.)

So what’s the next Big Thing in fracking that will increase productivity and lower costs? Nanotechnology. This means being able to engineer systems at the molecular level. And oil and gas is all about the molecules.

I’ve discovered a company that has proven nanotechnology in the oilpatch. They are able to use a chemistry that has smaller molecules than their competitors. The smaller molecules can be pushed farther up the fracks, and open more area for oil and gas to be released.

They recently tested 12 wells with one of the largest independent producers in the United States—a $40 billion company. Six wells used this new technology, and six did not. That’s a big deal, because trust me, producers don’t like testing new technology. Adoption rates are slow.

But the results were fantastic—all six of the wells using nanotechnology showed better flow rates—18%-33% better—for the same cost as using regular fracking technology.

I think it has the potential to be the next “killer app” in the Shale Revolution. This company already has positive cash flow, and it trades under $10/share.

The oilpatch is a tight-fisted industry. But “best practices” spreads like wildfire across a play. When they can buy a superior product for the same price (which actually gives better than industry margins to this nanotech supplier), they will buy it.

What I like most about this story is that this the ground floor for this opportunity—they have just started selling it. And they are already making expansion plans at their manufacturing facility for it.

As industry revenues get squeezed with lower commodity prices, they are jumping for a proven product that improves productivity and reduces costs. Get to know this company before it issues its next operational update—click here.

+Keith Schaefer

Why It’s Different This Time

0

Is this downturn in oil prices going to be different for investors?  I think it might.  In fact, I think North American energy companies have a good chance of withstanding this downfall in prices than any other downturn of the last 40 years.

You wouldn’t know it by looking at the recent carnage in oil stocks—especially the juniors and intermediates, which are off 30-50% in 6 weeks. This is severe, but is not without precedent. (In fact, once OPEC starts squabbling, history says oil prices drop 50% or more.)

But there is an argument that North American industry cash flows won’t be affected as much as the Market is now pricing in.  Nor will multiples.

Could it be true—could it be different this time?

Normally, retreats in the oil price due to OPEC bickering is a very painful period–because in energy stocks, not only do fundamentals deteriorate, Price-to-Cash-Flow multiples contract—that’s a double whammy for investors.

To illustrate–my experience is that the average operating costs for North American oil is about $40/barrel.  Now, that’s operating cost; not all-in (finding, developing and operating) cost.  So at $100 oil, that’s a $60/barrel gross profit.  When oil drops to $80/barrel, it’s a 20% drop in price but a 30% drop in gross profit.

The Market gives a higher multiple to more profitable companies.  As the oil price has dropped in the last two months, this chart from Canadian brokerage firm BMO Nesbitt Burns shows how multiples have already contracted:

chart1

But there really are a couple things different about the North American oilpatch now than at any other severe oil price downturn:

1.     Everybody has LOTS of land and drilling inventory—literally years, and sometimes even decades of low-risk drilling.

This means a couple things.

a)     E&P budgets no longer have to spend 40% of cash flows on high priced land grabs, which they have been doing for 10 years now.  So that’s a 25-40% increase in cash flows that can start happening if times get tough.

I wrote a story on this earlier this year, based on a report by US brokerage firm Raymond James, which you can read HERE. https://oilandgas-investments.com/2014/oil-and-gas-financial/free-cash-flow-should-energize-your-oil-and-gas-portfolio/

b)    And it’s not just that producers have lots of land—their drilling inventory is expanding—for free, due to “downspacing”.  Think of the space between wells in a big field.  The industry is moving from four wells a square mile to eight—and in some cases 16 or even up to 32!

That’s because the industry is finding they can frack wells much closer together than ever before thought possible without impacting the flow rate of other nearby wells.

On an NPV basis, the wells you aren’t going to drill for 20 years become meaningless—and a potential source of cash for producers in a free market.

2.     Improvements in drilling and fracking continue to improve returns.

a) In fracking, there was a step change in the summer of 2013 as EOG and Whiting—two large independent producers in the US—started using smaller, more tightly spaced fracks.  In essence, they used short wide fracks instead of long skinny fracks—and production increased dramatically.  The entire industry is now moving in this direction.

b) In drilling, a recent improvement is extra-long horizontal drilling—up to 2 miles—that are improving rates by 50-100% with only a 20% increase in costs.

c) The industry is moving to big “pad” drill sites where multiple wells can be drilled from the same place, in a circular or fan formation out from the well.  This is reducing drilling costs.

And the last point is—the Market always pays up for certainty/visibility of cash flows.  Economics are obviously important, but so is long term stable cash flow—no matter how big or small it is.

For the first time ever, the North American oil industry has a high certainty of how much oil they can produce for the next 20-30 years—just insert a specific oil price.

Every other time that OPEC has squabbled and sent prices down, the US and Canada were chasing conventional oil pools with short reserve lifes—but not this time.

That’s not good for everybody, but it is for the low cost producers.

Look at the stock charts of Canadian natural gas producers Peyto Explorations (PEY-TSX) and Tourmaline (TOU-TSX)—production grew and so did the stock price, in a very low gas price environment.   But the stock didn’t move up until the commodity price bottomed in April 2012.

The negative side of this argument however, is that the Saudis need to see oil under $60/barrel to really inflict pain on North American producers.

And until the oil price finds a bottom, none of these arguments are going to matter.

+Keith Schaefer

The Greatest Contrarian Call in the Oilpatch Today

0

Here’s a GREAT oil and gas stock: It has

  • A pristine balance sheet
  • An ultra-safe 5% dividend yield (represents only a 15% payout ratio)
  • A price to earnings ratio of only 2.5 times

Sound too good to be true? But it does exist. Just not in North America.

The company I’m talking about is Russian energy behemoth Gazprom (OTC:OGZPY). Like most Russian stocks the Gazprom story is complicated.

Gazprom isn’t just valued on economics—it’s a proxy for the Russian President Vladimir Putin. Entities controlled by the Russian Government own more than 50% of Gazprom.

“It’s the ultimate geopolitical contrarian speculation, and a very interesting speculation if you want to hedge on Russia expansing its global reach and power,” says Marin Katusa, Chief Energy Strategist at Casey Research and the author of a new book, THE COLDER WAR: How the Global Energy Trade Slipped from America’s Grasp, which will be published by Wiley in November.

Today, everything about investing in Russia is as scary as it has ever been. The country may or may not be on the verge of an all out war with the Ukraine, and its companies are now the target of aggressive American led sanctions.

And that’s why The Market Vectors Russian ETF (NYSE: RSX) currently trades at less than 5 times earnings. That isn’t one stock trading at less than 5 times earnings; that is the entire index of Russian stocks.

By comparison, the PE ratio for the S&P 500 is 19—almost four times higher than what companies trade for on the Russian exchange.

There is absolutely no doubt that Russian stocks should trade a discount, the country is full of corruption. Valuations that are only 25% of the United States though might be too extreme.

Katusa stresses he is not long Gazprom. But he says there are several factors that could cause Gazprom’s valuation to rise:

1. Ukraine peace

2. A cold winter

3. Russia/China announce the 30 year natural gas deal that is in yuan and ruble (i.e. non-US Dollar)

4. LNG success in Russia, and Katusa pointed to the fact that the giant French energy company TOTAL announced $27 Billion raise in non-USD to move forward with the LNG project in Russia.

5. The South Stream pipeline—designed to carry Russian gas to Europe but bypass Ukraine–gets built and starts flowing.

“Ironically, if something happened to Putin, GAZPROM would also rise in valuation,” adds Katusa, “as foreigners would speculate the company would work closer with Western powers–if that makes sense.

“And a new US president in two years could pull away from the failed US foreign policy and that alone could help Gazprom.”

Gazprom is a key supplier of natural gas for virtually every European country. For several countries, Gazprom is the only source of natural gas. Katusa says Gazprom earns 25% of its revenue from Germany.

gazprom


Source of image: Morgan Stanley

This is an important company that is not going anywhere and will not be “sanctioned” out of business.

How big is Gazprom? To give you an idea, consider that its peer group isn’t so much other oil and gas producers as it is entire nations that are part of OPEC.

Gazprom is one of the largest producers of energy in the world. In fact it is the single largest producer of natural gas on the entire planet.

In 2013 Forbes listed the largest energy producing (oil and natural gas combined) companies as being:

  1. Saudi Aramco – 12.7 million boe/day
  2. Gazprom – 8.3 million boe/day
  3. National Iranian Oil Company – 6.1 million boe/day
  4. Exxon Mobil – 5.3 million boe/day
  5. Rosneft – 4.6 million boe/day

Gazprom is 56% larger than Exxon Mobil and if it was a member of OPEC, Gazprom would be ranked number two !

A comparison with Exxon Mobil can help to more fully appreciate just how inexpensive Gazprom’s stock is.

In 2013, Gazprom’s production of 8.3 million boe/d was actually significantly higher than Exxon’s 5.3 million boe/d. But because Exxon has a higher oil weighting (oil production being more valuable), the two companies had virtually identical earnings of $32 billion.

Gazprom’s enterprise value (debt plus market cap) is roughly $130 billion. Exxon meanwhile with the exact same amount of earnings recently sported an enterprise value of $440 billion.

If Gazprom were an American company it would almost certainly be sporting a share price of more than three times where it trades today.

For investors who have a contrarian mindset, Russia and Gazprom specifically may be of interest. However–call me suspicious, but I’m not sure Mr. Putin would make for the most trustworthy of partners.

Even if the Ukraine situation calms down we have again been reminded of what a Putin-led Russia is capable of.

Baron Rothschild, an 18th century British nobleman and member of the Rothschild banking family was originally credited with saying that “The time to buy is when there’s blood in the streets.”

Rothschild spoke from experience. He made a fortune buying in the panic that followed the Battle of Waterloo against Napoleon.

Rothschild was a contrarian. For investors with a similar desire to be contrarian, Russia is certainly a place to look today.

+Keith Schaefer

Big NatGas Exports to Mexico in 2015 is a Pipe Dream

0
Natural gas bulls point to fast increasing exports of cheap US natgas to Mexico to bolster their thesis. Even I was guilty of this last year, when I ran a two part series on this in July 2013.But now I’ve learned this is simply not going to happen—at least until mid-2016, simply because the Mexican side of the big pipeline push is not ready for Big Exports until 2016.

I found it odd that I hadn’t heard much recently about Net Midstream’s huge 2.1 bcf/d (billion cubic feet per day) natural gas pipeline from Texas into Mexico—which is supposed to start December 2014.

A google search showed no new news since December 2013.  That’s odd for the biggest cross border pipeline into Mexico in years.  This pipeline should be big news in the US and Mexico.

But no news on this made me suspicious, so I started digging into some research.  And what I found was

1.    Natgas imports into Mexico are still increasing, but at only 8% so far this year, vs. 30% a year from 2010 to 2013.
2.    The Big Mexican Gas Pipe to central Mexico—Los Ramones Phase II—won’t be ready until mid-2016.  That’s when the bulls can start to really get excited.
3.    In fact, only 30% of the current cross-border natgas export capacity is being used because of internal pipeline constraints.
4.    Expensive LNG imports have been filling Mexican demand, though that should peak this year or next.  Much cheaper American gas will displace that—but not for a few years, until enough internal pipelines are built in the country.

In fact, energy experts Bentek out of Denver Colorado think US natgas exports to Mexico will only rise 1.5 bcf/d over the next five years—a far cry from the natgas bulls thinking 2.1 bcf/d is going over the border this December.

chart1

“The infrastructure on the Mexican side to get to demand areas isn’t in place,” says Bentek energy analyst Kaitlin Meese.  Bentek, owned by Platts, is one of the top analytical firms specializing in natural gas pipelines and gas flows.

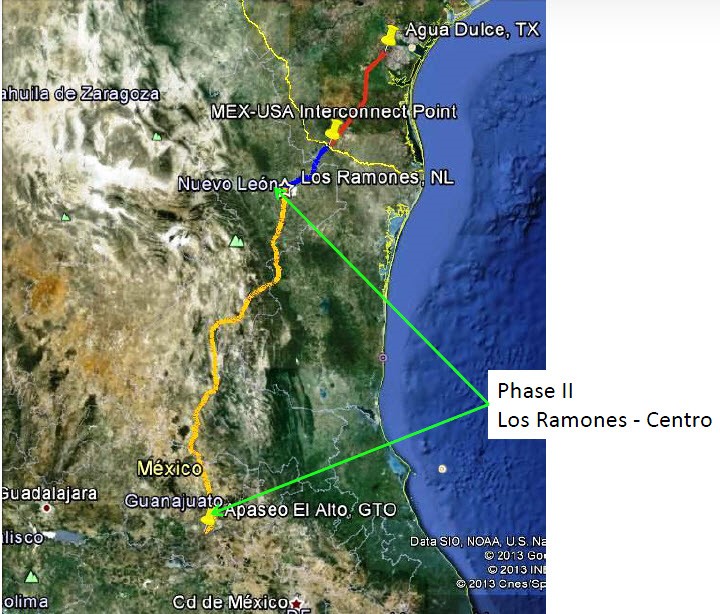
The pipeline on the Mexican side of the border that connects to the big 2.1 bcf/d Net Midstream pipe in Texas is called Los Ramones. The smaller Phase 1 should be ready by December 1 2014, according to FERC (Federal Energy Regulatory Commission) documents.

Los Ramones Phase 1 will have a design capacity of 2.1 Bcf/d and will run from the Net Mexico pipeline at the border  to Nuevo Leon, Mexico.

The problem is, Nuevo Leon is already well served with gas infrastructure.  So it doesn’t need that full amount.  All that cheap American gas can keep going south—except for the second problem is: Phase II of Los Ramones—which goes down to Guanajuato close to Mexico City–won’t be online until Q1-Q2 2016.

Los Ramones Phase II will take 1.43 bcf/d into central Mexico.  That’s when US exports to Mexico can really ramp up.

chart2 2

Source: www.gas.pemex.com

Meese says that as a result of those two issues, Bentek estimates that maximum utilization of Phase 1 will be 32% or 670 mmcf/d until the second phase is built in 2016.

So the big 2.1 bcf/d pipe export pipe dream will—at most—be just under one-third that amount for the first 18 months.

Meese was quick to point out that Bentek believes there is upside to their 2019 forecast of only 1.5bcf/d increase in US natgas exports to Mexico.

They are tracking a list of 47 power developments in Mexico that could create up to 4.3 bcf/d of power demand between now and 2026, with nearly 1.9 Bcf/d of power burn coming online by 2019.  It’s estimated that PEMEX has costs of $6-$7/mcf for domestic gas, so it makes sense that cheaper US gas could fill almost all that new demand.

And as PEMEX moves forward with it liberalization plan, it will be very focused on oil for years—not developing its own natural gas.

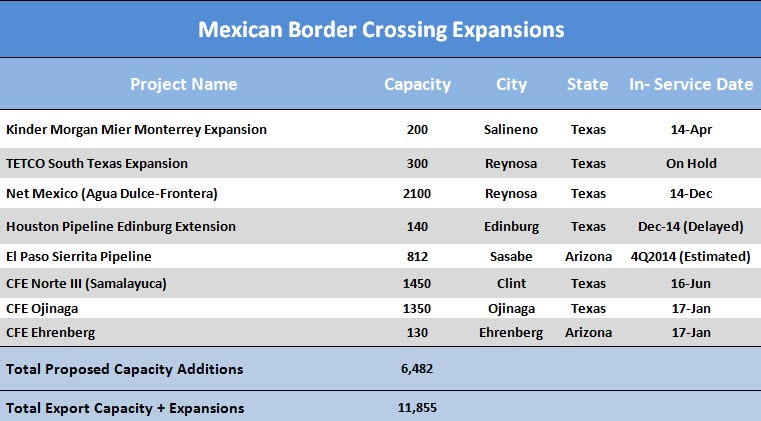
Aside from NET Mexico/Los Ramones, there are a few other projects on the Mexican side that could theoretically get built faster. But most of these are hooking into small lines on the U.S. side.

And most new U.S. pipeline projects are on the order of 0.1 to 0.3 BCF/d. That’s not going to make a huge impact on overall demand when you compare it to total U.S. gas production of 75 bcf/d.

chart3 2
Source: Bentek

The only logical explanation for this is that Mexico just isn’t ready to handle more gas coming from America. It doesn’t have the power demand right now, nor does it have the pipeline capacity down to the Mexico City-Guadalajara corridor.

When might that happen? Well, how long does it take to complete a billion-dollar construction project in Mexico? I don’t know—likely no one does, not even the Mexican government. The best guess offered by Bentek—with a lot of caveats—is at least two years.

So it turns out, this big story for US natural gas exports to Mexico might not be around the corner but rather a theme to look for in late 2016.

That’s the main story.  Now, there is a side-bar story to US exporting more natgas to Mexico, and that’s LNG—Liquid Natural Gas.

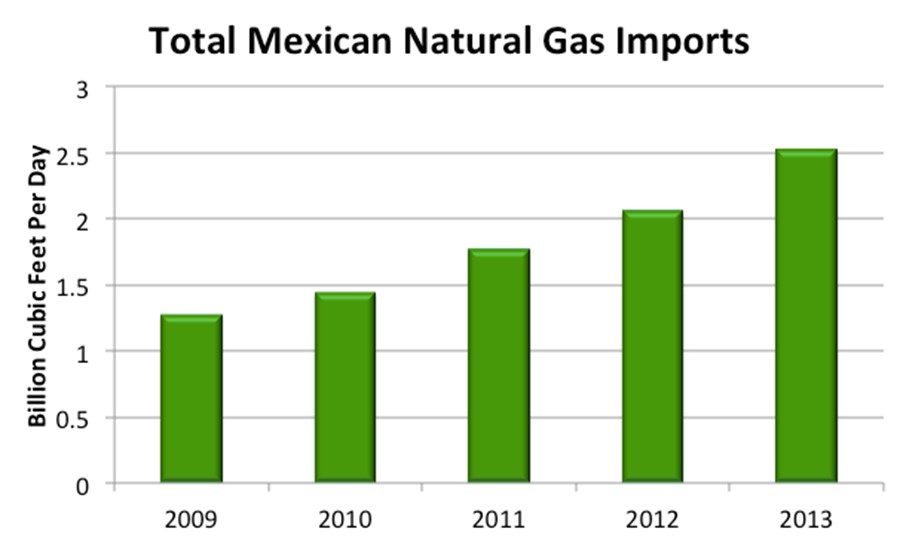
Here’s what overall Mexican natgas imports looked like for the last five years:

chart4 2
Source: BP Statistical Review

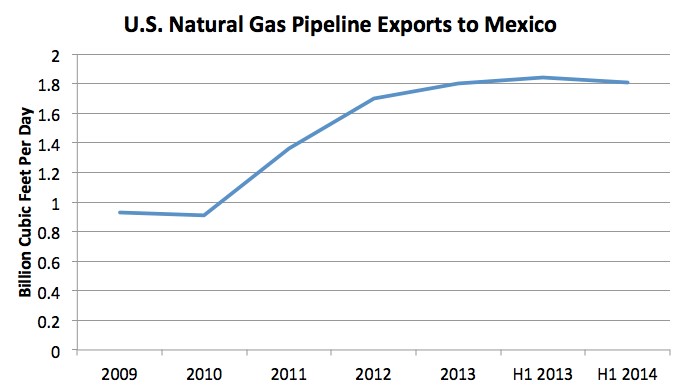
And as the chart below shows—using data from the BP Statistical Review—the hype about rising US imports into Mexico was justified up until the end last year.  Between 2010 and 2013, American producers’ shipments into Mexico doubled—from 0.91 bcf/d to 1.8 bcf/d.

chart5 2
Source: BP Statistical Review

That rise is what got a lot of analysts excited about the potential for export growth here. But the numbers so far in 2014 are much less bullish.

In fact Mexican imports of U.S. pipeline gas actually decreased slightly in early 2014—averaging 1.81 BCF/d, compared to 1.84 BCF/d during the first half of 2013.

LNG has picked up the slack—but that’s only going to be temporary; until Mexican pipeline capacity into the industrial central part of the country can displace it.

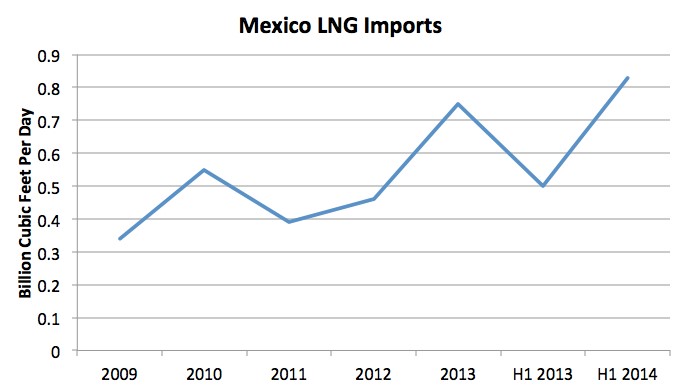
Shipments of LNG into Mexico took a big jump during the first half of 2014—rising 66% as compared to same period in 2013, to hit 0.83 BCF/d. As the chart below shows, that’s a significant rise in LNG supply over the last two years.

chart6
Source: BP Statistical Review

Ross Wyeno is an energy analyst at Bentek, and he suggests that LNG imports are peaking now:

“Manzanillo—the largest LNG import terminal in the country—is now paying a premium  to JKM (Japan Korea Malaysia—ks).  So Mexico is paying some of the most expensive gas in the world.”

“Once internal pipeline constraints are alleviated, they will push that LNG out of the market and gas exports to Mexico will increase dramatically.”

Mexico will get a break in some of their LNG pricing in 2015 when a 0.5 bcf/d contract with Peru kicks in—at only 95% of Henry Hub pricing (which is one third of JKM pricing).  But Wyeno suggests that contract is so out-of-the-market, it could get re-negotiated, and get sold on the open market—creating more room for pipeline imports from the US.

“The global disparity between US gas prices and global gas prices is way too high for there to be LNG imports into Mexico once the pipeline infrastructure is put into place.  A group could buy that contract from Peru and say ‘We’re going to re-agree upon the terms of this contract and we’re going to put it to an Asian buyer and we’ll split the spread.’

“That is pretty much what we’ve seen happen with a lot of these other long term contracts that have been broken.”

That would open up almost 1 bcf/d to US pipeline gas right away.  Wyeno says the US gas industry “could start delivering US gas over the border but you still can’t necessarily push out that gas until those two companies come to agreement. I’m not sure how long that takes.”

So cheap US gas exports to Mexico could displace all the 0.8 bcf/d that is now coming in from (mostly) very expensive LNG—but it will take years to get the internal pipeline network in place to do that.

It all adds up to great long term potential for US gas producers—but not in 2015.

Editor’s Note: Mexican exports will pay dividends for US natgas producers in 2-3 years. But why wait–why not get paid dividends now?  This energy stock has increased their dividend 11 (ELEVEN) times in the last four years.  That’s because they innovate and keep getting new business–especially in Texas. It’s a dividend machine that is making me wealthy.  These stocks are the best way to gain wealth.  Learn about this company: CLICK HERE

+Keith Schaefer

How do you Spend $35 Billion in a Town of 13,000 People?

0

The LNG (Liquid Natural Gas) countdown is on in Canada.  Within weeks, there are three major catalysts happening that could reshape the entire economy and labour market of western Canada.

1. The British Columbia government outlines its fiscal regime for LNG
2. The environmental assessment for the Petronas’ LNG facility in Prince Rupert will be issued
3. The Malaysian national oil company Petronas is widely expected to give a positive FID–Final Investment Decision–to build North America’s first greenfield LNG export terminal at Prince Rupert.

I spent three days in Prince Rupert in mid-August to get a first hand look at the leading sites, and I also drove two hours along the Skeena River over to Kitimat, the other potential hub, to check out a couple potential sites there as well.

I met with local business people—truckers, barge operators, bankers, town councillors and real estate developers among many. I visited the community offices of Petronas and BG Group here, talking to the people there—all just to get an idea of how these LNG initiatives are viewed in the community, and develop some relationships I can call on, as the promise of these multi-billion dollar spends turn into reality.

As a quick background there are at least 14 proposals to export LNG off Canada’s west coast, and another one to export Canadian gas down to Oregon and ship it to Asia from there.  (You can review them here:http://www.pipelinenewsnorth.ca/news/industry-news/b-c-s-15-lng-projects-where-they-stand-today-1.1122622 )

If they all get built, they would export more than the entire 13 billion cubic feet per day (bcf/d) that all of Canada produces today!  Nobody expects that, but 10 years from now it is conceivable that 5 bcf/d could be leaving Canadian soil.

What could this mean for the economy?  Consider that it costs roughly $7.5 billion to build 1 bcf/d of export capacity for aland based terminal. That huge cost is why there is increasing talk of using smaller, Floating LNG ships that would be built in Asia and towed over to Canada’s west coast.

I can’t think of another town in North America—certainly in Canada—that has the “optionality” of the Prince Rupert area. It’s a town of only 13,000 people, and $15 billion could get spent here in the coming 7 years. It’s actually on an island, but only by a normal sized bridge you would see on a highway overpass.

The town was founded in 1910 but really only grew after the American army built hundreds of homes in 1942, and built the road that first connected Prince Rupert to the rest of Canada—all in the name of getting US troops and armaments to Alaska to fight the widely expected Japanese naval invasion (which never came).

The two main industries of yore—fishing and forestry—have fallen on hard times. The town was re-invigorated in the early 2000s with a new deep port—one of the most modern and efficient in the world. It’s a direct ship-to-rail facility that can have a full train leaving for Chicago or Memphis—where 80% of the port of Prince Rupert’s cargo goes—in one day and be in those cities 96 hours after that.

There is a lot of room for expansion at the port. It’s deep and it has lots of protected coastline.

But the town doesn’t appear to be that excited about LNG just yet—and that is probably a good thing. A common—almost universal—comment from people was that the townsfolk are used to big companies promising prosperity, and not delivering anything.

Despite a shiny new port, the town’s infrastructure is in quite a state of disrepair. While housing prices and rents are up recently, they don’t compare to the jump that nearby Terrace BC (90 minutes east) has had, or Kitimat (another 30 minutes south).

Kitimat is where Rio Tinto, formerly Alcan, has its big aluminum smelter. Built in 1954 in a way that could never happen today—two tunnels through a mountain, moving streams, etc—the entire complex is just completing a huge multi-billion dollar refurbishment, and has kept that local economy strong.

The local council in Rupert is also heavily weighted to the political left, with the online resumes of councilors saying how they want to be the guardians for the environment against industry. Yet surprisingly, nobody sees development or LNG as a critical issue for the municipal elections coming this November.  The City of Prince Rupert has become active in the LNG game, trying to re-purpose Watson Island, where an old pulp mill sits, into an LNG site.

One morning I took an hour long helicopter ride around Prince Rupert to see all the major proposed LNG sites—Grassy Point to the north, and Ridley Island and Lelu Island to the south. It gave me great perspective on topography and potential logistics.

grassy point

I started up towards Grassy Point, which is the edge of the mainland about 15 miles north of Prince Rupert. The only road access is via a barge across an inlet onto First Nations land. As you fly close to Grassy Point, you can’t help but notice a very large, round and tall (50 metres?) hill that the proponents will have to drill, detonate and clear away.

I’m not 100% clear yet why the proposed pipelines are coming through what the inlet near Grassy Point, which the locals call the Portland Canal. It must be a lot cheaper to run these pipelines in the water.

portland canal

One of the big logistical challenges for all these facilities will be the very large tides in the area—sometimes 20 feet or more, compared to 3-4 feet or less on the Gulf Coast in the USA.

Grassy Point is more exposed to the ocean than the proposed sites near Prince Rupert, so they will also have to account for the huge rollers that the ocean creates quite often.

There is a lot of work happening at Grassy Point—at least one survey crew was down there with a helicopter, and I saw multiple sites where testing of some kind or another was being done.

One barge operator I had lunch with said he is busy 16 hours a day, 7 days a week. Labour is already VERY tight in the Rupert-Terrace-Kitimat area; anybody who can or wants to work is working. For all intents and purposes, unemployment is zero in that area. And construction of any LNG facility hasn’t even started.

There is tens of millions of dollars in pre-commitment, pre-construction spending this year in the region. One new restaurant has opened in Prince Rupert. ;-)

The helicopter only took 10 minutes to fly back over the centre of Prince Rupert—which, when it’s not raining or fogged in, is snuggled beautifully up against the mountain on Kaien Island. It was a cloudy day, and the pilot dodged the clouds as moved a couple miles south to where Petronas and BG are planning to have their sites.

prince rupert 1
This is Prince Rupert on the north (front) side of Kaien Island.  Flying just around the corner of that hill you would see Ridley Island.

prince rupert 2
Downtown Prince Rupert at top, and kitschy Cow Bay right underneath me
I think the best sites are in the south, despite the fact that right now, the pipelines look they are going to come in from the north. Two of the largest proposed LNG facilities—Lelu Island and Ridley Island—are very close to towns.

lng facilities

BG Group has, IMHO, the best site: Ridley Island, whose northern edge is just over a mile south of town. It’s a flat piece of land—I don’t think it’s actually even an island anymore as it has been developed so much–a big coal terminal is already there. It already has zoning. It has the waterfront that’s deep for an LNG carrier. It’s just out of sight from the town itself.

lng facility Ridley Island

Watson Island in foreground with old pulp mill; Ridley Island in background where grain elevators are.  I’m looking west and the land at the top of the photo is the south (back) side of Kaien Island; Prince Rupert is on the other side.

The only issue is BG doesn’t have a partner or any vertical integration—they have no upstream producing gas reserves or assets. Former Prince Rupert mayor Herb Pond is their community relations manager.

BG and Petronas are developing their LNG strategies completely opposite to each other. Petronas is completely vertically integrated in their approach, having spent $6 billion to buy Progress a few years ago, and having other Asian natural gas buyers in their consortium.

Petronas is widely expected to be the first group to give a positive Final Investment Decision (FID) to their LNG plan, and the Market expects this in November or December. I would suggest it’s going to be 2-3 months later than that. The BC government will announce their tax/fiscal regime for LNG in late October (industry is deep in those negotiations now; so it won’t be a surprise). Petronas will announce the results of their Environmental Application (EA) process in November. This is, to me, a big wild card, and the chance of something needing tweaking (one set of tweaks has already been made public) is high.

I have no doubt Petronas will say yes, but they have to say yes at the right time and in the right way, and I’m not sure that time will be by Year End 2014.

Lelu Island is also flat, and it’s truly just a stone’s throw from the 800-person town of Port Edward, about 3-4 miles from Prince Rupert proper. I could probably walk to Lelu Island from Port Edward at low tide in less than two minutes—it’s that close. And the footprint for the Petronas LNG facility takes up every square inch of that island. That’s a lot of high concrete close to homes.

The other issue Lelu Island has is that it is right at the mouth of the Skeena River, the single most important river in the northwest of British Columbia. What the Ganges River is to India and the Hindu faith, the Skeena is to First Nations here. And no LNG development is getting off the ground without their full involvement and support. If they think their fishing will get disrupted, there will be a lot more negotiating.  I would expect ALL of Petronas EA issues to be marine related, and most of it around it being at the mouth of the Skeena.

skeena river
Skeena River shot by yours truly
Port Edward has a separate town council–more pro-development–and Petronas has already given the town millions of dollars to begin improving infrastructure. Council has visited a Petronas LNG facility in Malaysia, with the noise issue being one of the top items to investigate—but it ended up being much quieter than the old pulp mill that shut down 20 years ago.

Late this fall will be a very exciting time for this area.  I believe an incredible amount of prosperity is about to hit this region.  It’s building already.

The next Big Stage with LNG will start this fall with the provincial government’s new tax regime.Then the EA for Petronas gets approved–or not. Then the FID from Petronas.

But there are challenges. High tides. Big Mountains. Tight waterways. A local labour force already full.

All the stakeholders will have to pull together to make this the success it should be.

+Keith Schaefer
This Is The Best Sector For The Next Decade, And This Might Be The Best Opportunity In It

0

The Energy Sector is having a RED day; a down day as oil prices re-trench.  Oil is supposed to do that at this time of year–the shoulder season between summer driving season and winter heating.

But it always makes me re-think my investing strategies.  So right NOW–if I had to–where would I put ALL my money?  Easy question.  I wouldn’t need five seconds to think about it–the North American Energy Services sector.

This isn’t a new idea. Most of these stocks have had Big Runs in the last couple years.  So when I find a junior stock doing over $100 million revenue, with a very normal 15-20% EBITDA margin, less than 20 million shares out and where the Chairman owns 33% of the stock—and trading at a discount to its peer group…well, I get excited.

Look at Aveda Transportation and Energy Services, symbol AVE-TSXv.  I bet you’ve never heard of it. They move drilling rigs all around North America, from pad to pad in one field and field to field in a play.  Based in Calgary, they do 85% of their business in the US—so when you look at the trend of a higher US dollar hurting the energy sector–this is a stock where the lower Canadian dollar is a great tailwind.

You don’t need to be Warren Buffett to figure out that energy services companies are in the catbird seat.   Horizontal drilling has revolutionized and re-invigorated the North American energy business—but those wells decline fast—70% in the first year.

That means a huge number of wells need to be drilled just to maintain production and even more if we want to grow production.

In 2014 RBC Capital Markets estimates that 20,061 horizontal wells will be drilled in the United States alone, and in 2015 that number grows to 21,551.  On top of that American activity, horizontal drilling in Canada is going to accelerate as the deep Duvernay formation hits development mode and LNG export related drilling in the Montney and Horn River plays in British Columbia hits a frenetic pace.

Energy services companies aren’t going to just enjoy huge volume growth, they will also be able to charge premium prices for years to come because their services will be in short supply.

Aveda has so far slipped under the radar of almost all institutional investors.  Until this year trading volume on the stock was so low that most institutions wouldn’t have been able to build a position even if they wanted to.

That is starting to change as the company is increasingly being recognized and daily trading volume picking up.    18 months ago the stock traded 5,000 shares a day traded—now it’s over 50,000.

Aveda gives shareholders a lot of leverage to rising cash flow—because there is only 19 million shares outstanding.  That also means the stock is a thin trader.

Chairman Dave Werklund owns 33% of those shares.  Few people outside of the oilpatch would know Werklund but this man has a huge success behind him–in  1984 he founded a small oilfield service company called Canadian Crude Separators (CCS) with an initial investment of $50,000.

By 2007 CCS had become a huge company with $3.7 billion in annual sales.  Today it is part of a rebranded group of companies called Tervita Corporation which does more than $5 billion annually.

There aren’t many companies the small size of Aveda that have the full attention of a businessman like Werklund.

Werklund is only batting in the first inning at Aveda, and he has already created the largest pure-play drilling rig company in North America.  Aveda’s job is to move drilling rigs and other equipment between drilling sites.

Aveda estimates that each drilling rig moves 17 times a year and than in 2014 there will be 35,700 rig moves in North America.

aveda truck
Source: Aveda Energy and Transportation July 2014 Corporate Presentation

Werklund isn’t the only competitive edge I see in Aveda.

You see, the biggest trend in this space is safety. Safety sounds boring, but it’s incredibly profitable for Aveda—they have established themselves as the standard for safety and speed.

Anyone who knows trucking knows there are a lot of “mom-and-pop” operators out there.  And I’m sure many are good.

But the reality is that the larger producers who now dominate the Shale Revolution are not going to entrust their $30 million rig to a mom-and-pop who doesn’t have the insurance, the safety, and the standardized procedures to get rig moves done.

That’s why Aveda isn’t known as the cheapest operator, but rather the one with biggest, safest and fastest equipment.  Aveda is the high quality operator and so its customer list is mainly the largest producers in the business.

And all this feeds on getting higher quality employees.  And if there’s one thing I’ve learned about the energy services sector—that business is all about HR; Human Resources.  Get the best employees and pay them well.

Aveda has the staff, training and safety to get rig moves done faster—often a lot faster—than smaller operators.  That means less rig downtime which means lower costs and larger profits.  For that customers are willing to pay a premium rate to Aveda.

The good news about all these “mom-and-pop” operators is that they are undercapitalized, and there’s LOTS of them.  This fragmentation means the industry is ripe for consolidation.  That should present some interesting growth opportunities for Aveda.

Management is pretty open that their M&A pipeline is full.  That doesn’t mean any of them are close, but there’s lots of opportunities.

It’s interesting that their two latest deals—which have doubled the company—have come from larger companies.  They bought Precision Drilling’s (PDS-NYSE; PD-TSX) equipment in the US—and PD is one of their big customers.
They have already generated organic growth out of the PD deal, opening up a new branch in Oklahoma right away.

The larger M&K acquisition in January 2014 is almost fully integrated, CFO Bharat Mahajan told me, and they expect organic growth to start from that in late Q3 and Q4.  Analysts are suggesting just over 15% of growth this year will be organic.

EBITDA margins were 15% last year, and will be 19-20% this year.  Margins have been as high as 28%, but I expect this to be a 20-22% margin business.

They have only added debt to do acquisitions—Precision was 100% debt, and the other ones used partial debt–roughly $55 million they have just over 2x debt to trailing cash flow.

Aveda trades at just under 5.8x Enterprise Value to cash flow. The peer group is 7.1x average.  I would expect Aveda to trade just over peer group because it has a surprisingly low cost of capital; maintenance capex for them is incredibly small.  Annual capex is only $13 million.

What I expect to happen in the coming months is for the discount that Aveda trades at to its peers to slowly disappear—while the company grows, which should give investors a slingshot share price.

aveda chart

Source: Aveda Energy and Transportation July 2014 Corporate Presentation

That discounted multiple is not related to a lack of growth, it is simply due to a lack of attention.  Year on year Aveda’s EBITDA has grown by 53%, and I would expect that rapid growth to continue both organically and through acquisition.

Acquiring some of the smaller undercapitalized private operators could be very accretive for Aveda as these deals can get done at less than 4x EBITDA.

As Aveda integrates the M&K deal and starts generating stronger organic growth, there’s an opportunity for investors to see a double whammy of valuation multiple expansion and higher overall revenue and EBITDA growth.

They’ve got proven management and critical mass in a tight niche—they can dominate larger scale moves.

Right now, the energy services sector is my favourite place to invest and within that sector Aveda is one of the best stories investors have never heard of.

+Keith Schaefer

Investor Beware, 2P Reports for Tight Oil and Gas Plays Can Leave Out Key Information Part II

0

In Part One of this series I introduced readers to “Kurt’s Bible” a great piece of energy stock investing wisdom written by Canadian energy analyst Kurt Molnar of Raymond James.

In Part Two here, I want to warn energy stock investors of a huge risk that they are taking if they rely on the proved and probable reserve data being published by energy producers today.

Molnar raises the issue eloquently in his report and I think every energy stock investor needs to know about it.

This risk has been created by the horizontal drilling and multi-stage fracturing revolution—which has completely changed the energy game.

What horizontal drilling and fracking has done is turn what was an exploration and production business into a manufacturing operation. Prior to the horizontal revolution, exploration a was lot more hit-and-miss. Especially for smaller and midsize producers, production growth was hard to see until a well hit.

Tight oil or shale plays are generally much more consistent over a larger area, and it’s now common for an energy producer to have a decade of horizontal development drilling locations.

The “E” from E&P–exploration and production–business is pretty much gone. Today it is more about “D”–development.

This new long-term visibility on future production is great for the companies and their investors—years of low-risk drilling is good! But it means a very large number of future drilling locations can be included by reserve engineers in proved and probable (2P) reserve numbers.

This is where A Big Problem is being created for investors relying on these numbers.

The Problem isn’t that the future drilling locations aren’t real. The oil is there and the companies know how to get it out.

The Problem is that while these drilling locations are included in the reserve report, producers don’t need to have the financial means to fund the development of these locations.

It is important to note that in a reserve report, only the proved producing reserves—what the industry calls 1P–are guaranteed to be fully funded.

But for 2P reserves—Proven AND probable—a producer might have to issue a huge amount of equity—or take on massive debt–in order to actually fund the development of those reserves. Both these options greatly increase theEnterprise Value (EV) of a company. (EV=market cap + debt or – cash.)

The independent engineering company prepares the reserve report. They always estimates (and discloses) the amount of development capital required to develop the proved and probable reserves.

But the underlying E&P company is under no obligation to explain to investors where that development capital is going to come from.

These next three paragraphs are really important for investors to understand:

Many companies like to present to investors just how “cheap” their stock is by comparing their proved and probable net asset value, or 2P numbers (reserve value less total net debt divided by shares outstanding) to the current share price.

You see, great companies trade at 2x NAV. Good companies trade at 1.5x NAV. Average companies trade at 1x NAV. Explorers trade 0.3-0.8 NAV

What these companies often leave out is that it may require a huge increase in the current share count or total debt in order to raise the necessary development capital to generate the production assumed in that reserve report.

If that share count or debt increase were to be factored in the true net asset value per share may not look cheap at all relative to the current share price. In fact the same company might actually look quite expensive.

An extreme real life example can help illustrate this issue (and honestly, if you’re not an accountant it’s still pretty vague):

Arcan Resources (TSX:ARN) is a company that on a net asset value basis could look extraordinarily tempting to investors.

According to its independent reserve engineers Arcan has a proved and probable present reserve value (discounted at 10%) of $582.8 million.

Arcan

Source of image: Arcan Resources April 2014 presentation

In its April 2, 2014 press release Arcan reports its net asset value per share using this estimate of reserve value to be $2.53. Meanwhile the recent share price for Arcan has been trading around $0.30.

Wow, Arcan’s net asset value is eight times more than the current share price. Most decent producers trade at a slight premium or slight discount to their NAV. Is this a huge opportunity or is there more to the story?

The answer lies in the development capital assumptions included in Arcan’s third party engineering report (below).

development costs

To realize the $582.8 million of reserve value and $5.32 of net asset value, Arcan is going to need to spend $69 million in 2014, $104 million in 2015 and $75 million in 2016 developing its property.

Meanwhile, for 2014 Arcan is estimating that it will have only $41 million of cash flow in 2014 with production shrinking slightly over the course of the year.

Over the next three years Arcan is likely going to generate less than $120 million in cash flow while the engineering report is assuming that Arcan will spend $246 million.

There is a big ($126 million) hole here that needs to be filled.

The obvious question then becomes how does Arcan fund the $246 million of capital spending assumed in the reserve report over the next three years when it is only likely to have at best $120 million of cash flow? Every option available for Arcan is going to create significant dilution in the net asset value per share.

To raise the almost $126 million it needs to meet the development capital assumed in the reserve report Arcan would have to issue 420 million shares. That would quintuple the current share count at current prices.

Other alternatives would be asset sales or additional debt both of which would again significantly alter the net asset value figure provided by Arcan.

To put it bluntly, Arcan’s net asset value is virtually meaningless in relation to the real world situation the company finds itself in.

Arcan is an extreme example because the company is in considerable financial distress with its overleveraged balance sheet. But the issue is very real across the entire industry, and investors need to be aware of it.

The net asset value figures provided by companies should be taken with more than a single grain of salt.

In the Arcan instance and the others across the industry this isn’t a case of the engineering companies or the E&P companies themselves violating any reporting standards.

No, it’s more of a case in the industry where management decides what information to publish prominently to put their best foot forward–and what information to bury in the financial notes. And I would suggest that the more an E&P company’s net asset value is impacted by this the less likely it will be to make mention of it.

Molnar suggests, and I certainly agree, that there is nothing wrong with an E&P company showcasing it theoretical equity value by referencing the engineering report. However, he says it’s important for investors to understand the potential impact on dilution; the number of shares or amount of debt that will be required.

+Keith Schaefer

Why Don’t Your Stocks Go Up? You’re Asking the Wrong Questions

0

Ever wonder why the stock of an energy company you love doesn’t go up? You’ve analyzed it and you think it’s undervalued. But the stock doesn’t go up.

Well, I just finished reading one of the best explanations of why that happens. It’s a November 2013 report from oil and gas analyst Kurt Molnar of the Canadian arm of Raymond James. He sent it out to his retail stockbrokers to introduce himself and his philosophy. It’s a heavy 40 pages, but it’s solid gold. And he has graciously allowed me to share some of the key points with my readers.

The simple answer to the question above is—because almost assuredly—you’re asking the wrong questions, and paying attention to the wrong metrics.

Many retail investors get lost in headline growth numbers—growth in production and revenue. Molnar suggests we should be focused on how much return a management team can get for every dollar they invest in their business.

In other words, quality is much more important than quantity.

Molnar thinks that investors need to “quality adjust” the metrics that energy producers report—specifically, three key data points:

  • netback, or profit per barrel produced
  • Growth in free cash flow—any cash flow over what it takes to keep the proved producing reserve level flat
  • Return on invested capital

To help visualize what he is saying, Molnar has provided us with the concept of “the boot”.

chart1

The graphic above shows the break-even price for wells being drilled into various natural gas plays. You can see that the chart roughly forms the shape of the boot.

Molnar wants to invest only in companies that have assets located in the “toe” of the boot. These are the plays with the very lowest break-even costs, and generally the highest 1P recycle ratios. A 1P recycle ratio is the profit per proven producing barrel divided by the cost to get that proven barrel out of the ground.

Investors want to own stocks that have a higher recycle ratio—at least 2:1.

Over time what will drive company—and stock—performance is the return that it is generating on the cash it is investing. And the key to generating returns on cash being invested is to have low cost, high margin oil and gas wells; wells that reside in the toe of the boot.

When one company can invest its cash for the next 10 years into a hugely profitable play while another has only mediocre opportunities…that compounding interest will make it a far superior investment going forward.

Molnar is adamant that the best plays should have a big premium, and the lower quality ones should likely be valued lower than they are in today’s Canadian junior marketplace.

(I always tell my subscribers—we WANT to own expensive stocks; they stay expensive. Cheap stocks stay cheap; few make the jump.)

And it isn’t that headline growth isn’t good. The problem is that the market does a lousy job in evaluating how much money a company is making while growing. What really matters is how profitable that growth actually is.

These high recycle ratio companies are the ones that will generate the most wealth for shareholders. And not only does the toe-of-the-boot give the highest returns, he shows they are also the least risky.

They have the lowest full cycle development costs, so they continue to make money in low points of the commodity cycle. Meanwhile, the companies with only heel-of-the-boot assets will lose money drilling wells at low commodity prices.

According to Molnar, the poster child for the type of company investors should be looking is Peyto Exploration (PEY:TSX).

chart2

In 2007 Peyto was 83% weighted to natural gas and over the next five years that weighting increased to 89%. Considering that over that same time period the price of natural gas dropped from $8.42/mcf to $3.46/mcf, you would expect that Peyto would have been suffering.

Instead the company has thrived.

That success is directly related to Peyto having assets that live in the “toe” of Molnar’s boot.

Peyto’s asset base allows the company to be the lowest cost producer. A company that can continue to be profitable and grow at commodity price lows and thrive when commodity prices are high.

Now, when I translate all that to my own experience learning about the oilpatch over the last five years, I realize I have never seen a comparison or “comp” chart of 1P recycle ratios from any brokerage firm in the US or Canada. That’s where the Top 30 juniors and intermediate producers in Canada and the US would be lined up and compared (hence the “comp” lingo) in a chart—like the boot above—ranked in order of 1P recycle ratio (which would be an average over the last three years).

Why is that? Because to sell The Energy Game to investors, everyone uses 2P numbers—Proven and Probable. Molnar’s missive goes into great detail why investors need to be very wary of that—and I’ll detail that in Part II.

+Keith Schaefer

Privacy Overview

This website uses cookies so that we can provide you with the best user experience possible. Cookie information is stored in your browser and performs functions such as recognising you when you return to our website and helping our team to understand which sections of the website you find most interesting and useful.