
It has been a rough week for global stock markets. But there is still One Big “Gimme” in investing markets. It’s a commodity that will have no cycle for the next 10 years—I expect it to go straight up with almost no volatility.
I’m talking about CARBON.
That’s because CLIMATE is the #1 investing meme for the next 10 years.
Whether we go to Net Zero or some other worthy goal of reducing carbon, one thing is clear:
The world will be spending TRILLIONS on trying to meet the targe of the world warming only 1.5 degree Celsius by the end of the century.
For sure, climate will be the #1 investing meme through the 2020s.
Carbon pricing will be front and center on that. People will check carbon prices daily like they check gold, copper, oil, (and now bitcoin).
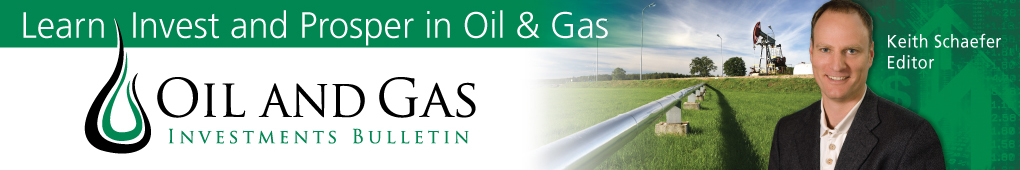
The way I’ve chosen to play this—and there is no perfect way—is through the Kraneshares ETF, symbol KRBN-NYSE. KRBN is an ETF that follows the price of carbon. I first bought it at $31 and I’m still buying it.
There has been a steady uptrend here with almost no volatility. Can it continue?
Now is an interesting time to revisit this purchase, as this ETF is quite different (unique??) in that it only rolls over its futures contracts once a year, versus once a month for most ETFs that buy futures contracts.
KRBN “rolled”—or had to change its contract—last month; November. KRBN is unlike oil ETFs which include the cost of physical storage in their roll—so it’s MUCH more efficient. , The roll was about 2% or less. So when the carbon market is this stable, it’s a great product.
I bought KRBN in April at $31.25, and it’s up about 50%.
Source: Stockcharts.com
In the short-term, say this winter, KRBN is going to be driven by EU energy issues. If we get a cold winter – one that requires big-time coal consumption, expect KRBN to move higher yet.
In the long-run, there is only one direction for KRBN to go – up! That is because rising carbon prices are literally baked into the cake. The reality of carbon trading is that prices eventually have to go up.
How Does Carbon Trading Work?
There are a growing number of regions that have carbon trading schemes. Two of the biggest are the European Union (which has EU Allowances) and California (which has California Carbon Allowances).
To understand how these allowances work, take EU Allowances (EUA) as an example.
An EUA is an emission allowance that lets the holder emit one ton of carbon dioxide. Companies can trade EUAs if they expect to run a surplus or deficit of carbon emissions for a given year.
The EU issues new EUAs each year in February. There is fairly complicated process used to determine who gets the new EUAs.
Companies buy or sell EUAs via exchanges. The Intercontinental Exchange (ICE) is the most liquid exchange for trading EUAs. The Chicago Mercantile Exchange also lists EUA contracts.
Participants in EUA carbon trading range from electricity utilities, industrial manufacturers to investment banks, hedge funds and even retail investors.
These contracts are all physically settled. The contract transfers the underlying EUA between the counterparties 3 days after the last day of trading for that contract month.
The key feature of these contracts is that every year, the number of EUAs issued goes down. Supply goes down, every year.
In some cases, there are even mechanisms in place to insure the price does not go down.
In California they have an auction reserve price that they won’t auction off allowances below. And that auction reserve price goes up 5% plus inflation every year.
In Europe there is the same sort of lever available, called a market stability reserve, which allows them to pull credits out of the market if prices begin to decline too much.
This virtually assures that the price of the EUA will go up. In fact, that is exactly the intent.
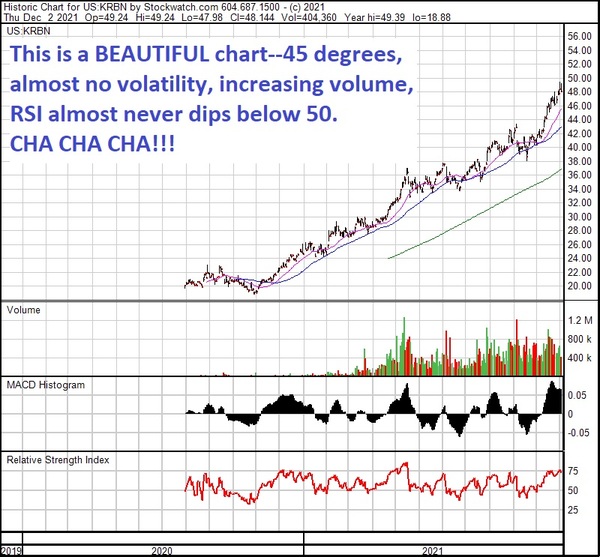
KRBN – Also Buying Carbon Allowances
The KRBN ETF also buys carbon futures. The fund is made up of a combination of European Union Allowances (EUAs) and California Carbon Allowances (CCAs). The weightings track the IHS Markit Global Carbon Index.
Source: KraneShares.com
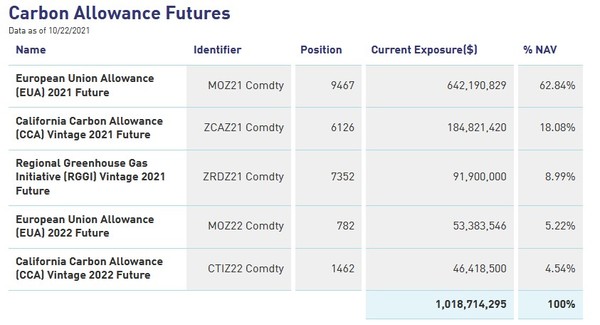
This move (KRBN is up 44% in the last 6 months and has roughly doubled in the last year) is right inline with the move we have seen in the Carbon Index:
Source: IHS.com
It has been such a strong move up that it has me asking – can it last?
To answer that, I’ve dug into the factors that are driving the move.
Fundamentals
KRBN is largely made up of European Union credits. It is EU policy changes that impact it the most.
In July, the European Union unveiled its “Fit for 55” package.
While this sounds like a new exercise craze, it’s not. It is a new set of targets focused on renewable energy, emissions trading, and a foreign levy on carbon intensive imports.
The package aims to bring emissions down to 55% below 1990 levels by 2030.
This will be accomplished by tightening the EU cap-and-trade rules. Europe’s market stability reserve, the mechanism they use to “manage” prices higher, will be buying 24% of credits at auction. As well the floor on prices will be increasing by 4% a year, up from 2%.
EU carbon prices, which had begun to level off in the spring, made another leg higher after the launch of the program:
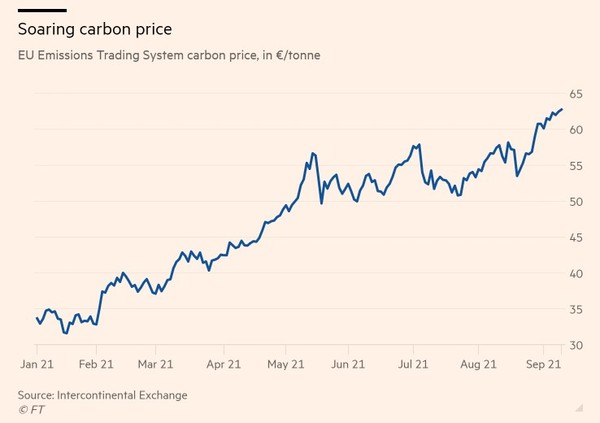
Source: FT.com
More stringent carbon emissions and more industries that have to comply mean higher carbon prices.
That is why the single greatest determiner of price here is whether carbon mandates will accelerate or slow down.
Acceleration is happening in Europe and that is not the only region.
The second regional focus of KRBN is California.
California’s carbon goals are ambitious to say the least.
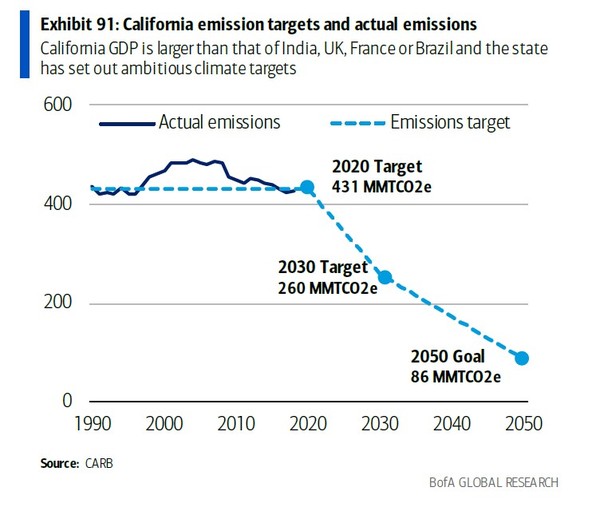
Source: BofA Global Markets
While California’s emissions have been roughly flat over the past 30 years, their targets are anything but.
If California is going to achieve these dramatic emission reductions it just has to mean higher carbon prices.
Analysts Increasing Numbers
When we wrote about carbon prices earlier this year, we used forecasts like $100 per tonne or $150 per tonne by 2030 to 2035.
Those numbers are coming from governments – the EU, California and Canada for example.
But these are only estimates. We wondered – what if carbon prices need to be higher to achieve the climate goals.
Turns out we aren’t the only ones wondering about this.
BofA Global Research recently put out a report titled “A Transwarming World Net Zero Primer” where they asked this question.
Their report identified 4 possible scenarios for net zero.
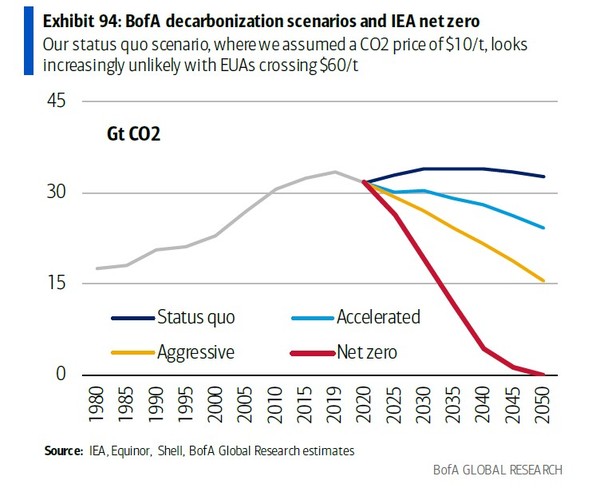
Source: BofA Global Research
The status quo and even the accelerated scenarios are not interesting to me. It simply isn’t going to happen.
The world has gone too far down the road of carbon mitigation to backtrack now.
What about the aggressive and net zero scenarios? They could mean higher carbon prices than we think.
In the aggressive and net zero scenarios, BofA Global Research estimates a global carbon price of $100/t and $200/t will be needed, respectively.
The key word here is global. A number of lower income countries are simply not going to pay that.
That means carbon prices in the developed world are likely to be multiples of those in the developing world.
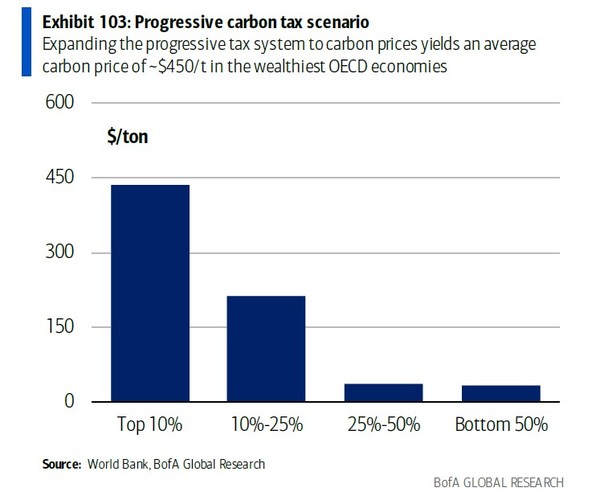
Source: BofA Global Research
Expect far higher carbon prices – as high as $450/t – in regions like the United States and Europe.
Goldman Sachs approaches the problem from a different angle. What is the “average abatement cost”?
By that, they mean for each of the sources of carbon emissions, how much will it cost to remove those emissions?
Some sources, like electricity, are relatively straightforward. Switch away from coal. Others, like shipping, aviation and some types of construction, are much higher.
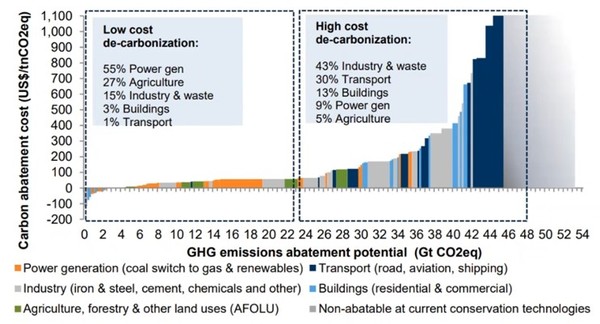
Source: Goldman Sachs Carbonomics
To squeeze those last giga-tonnes of carbon out of the atmosphere could come at a steep price.
BofA research also points to price spikes as carbon reduction approaches its limits.
Also, remember that carbon allowance prices should be inversely linked to actual tons of CO2 emitted. In a corner solution, annual emissions prices could thus skyrocket past $10,000/t, particularly if carbon capture capabilities prove limited, as the global economy approaches net zero emissions into 2045 (Exhibit 101).
Now before you get too excited, remember that’s a long way off – they are talking 20 years before this kind of scenario plays out.
But it goes to show just how unknown this market is.
A Big Influx into ETFs
But maybe the most interesting driver of carbon prices has simply been the interest in carbon prices.
KRBN hit the IPO trail in 2020 with a splash. It has only grown in popularity since that time.
John Kerry was one of the original backers.
At the time of the IPO Kerry held “a small stake in the firm”. At the time he was an advisor to Climate Finance Partners – which themselves advises on the fund and holds a position in KRBN.
Kerry may still own a position in KRBN. While he resigned from his position as chairman of the advisory board at Climate Finance Partners when he was appointed Secretary of State by the Biden administration, there is no sign he sold his interest in the firm.
The KraneShares fund is worth over $1 billion right now. That NAV is heavily weighted to EUA carbon futures.
That is still small compared to the carbon market. The EU carbon market is close to $250 billion while the California market is ~$25 billion.
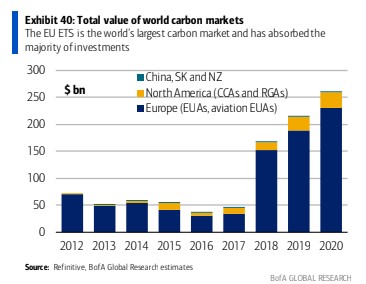
Source: BofA Global Markets
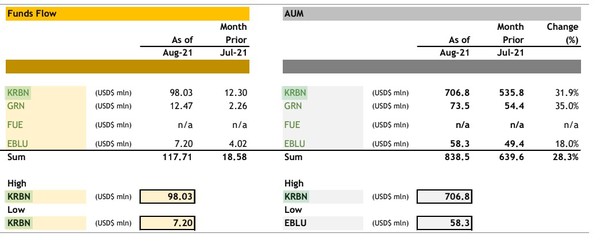
But in terms of flows, KRBN and its sister fund, GRN, are growing fast. KRBN saw 32% month-over-month increase in AUM (Assets Under Management). As of October 22nd net AUM had increased to $1.02 billion – another $300 million over August.
Source: National Bank
AUM will almost certainly continue to expand. It is going to be helped by two new issues.
KraneShares is launching two new products. These are separate European and California Carbon ETFs:
KEUA and KCCA.
The KraneShares European Carbon Allowance ETF (KEUA) and KraneShares California Carbon Allowance ETF (KCCA) have been listed on NYSE.
So now you have TWO MORE ETFs buying the same futures. In a very bullish market for carbon prices (NOBODY sees carbon prices declining; climate is the #1 investing meme for this decade) this is like an endless bid.
While I question the attraction of owning Union Allowances (EUA) or California Carbon Allowances (CCA) versus a fund that owns both, I do know that these are just more dollars that will be stuffed into carbon futures.
The bottom line is that the move in the ETFs is not the result of rampant speculation. The market value of KRBN is less 2% above the NAV.
This is the sort of ETF I would think could trade at a significant premium to NAV.
One way to look at it is that given the virtual certainty that carbon prices will rise over the long run, you are getting a ~8% return on KRBN on the assumption we get to $125/t carbon by 2030.
While that is no barn burner return, it seems fair given a relatively low risk.
The only volatility I see in KBRN is that I have noticed it appears to move down when the market does–to the point where if we saw a BIG pullback in the S&P 500, how would it perform–despite the underlying strength of carbon pricing.
To me, KRBN still looks like a good long-term bet–it acts relatively efficiently, and it is one of the most obvious ways to play the #1 Market Meme of the decade.
EDITORS NOTE–get ready for my new #1 Market Meme stock–a “triple threat” to help reduce carbon emissions globally–including taking direct aim at one of the world’s largest polluting industries. It trades under $1, and I think has the team and the plan to make it a multi-bagger in the coming years. Click Here

 VS. TECHNICALS (GOOD)")


