
The EIA’s Weekly Crude Oil Inventory Data
A New Source (and era) of Volatility
Rightly or wrongly, the EIA’s crude oil inventory reports move global markets: Right before the EIA #s came out three Wednesdays ago, WTI crude oil was trading slightly higher—then plunged $1.61/barrel in just two minutes after the Weekly Petroleum Status Report came out.
The report showed a surprise 3.32 million barrel build in U.S. crude oil inventories, significantly differing from consensus forecasts calling for a 3.25 million barrel draw.
Crude oil prices have since been unable to recover–down about 15%. If it feels like weekly crude oil inventory releases are becoming more unpredictable – it’s because they are!
In the five years leading up to June 30th, 2016 analysts forecasted weekly U.S. crude oil inventory changes with an absolute average error of 2.83 million barrels (0.404 million bopd) – a pretty dismal record, but for good reason: The EIA weekly inventory data is largely unpredictable – with some components appearing to be fabricated at times and an ‘adjustment factor’ averaging 1.01 barrels per week (0.144 bopd). (Every once in awhile you see SeekingAlpha stories or even in Reuters/Bloomberg talking about how big this # is.)
Since June 30th, 2016, the average absolute error of consensus crude oil inventory change forecasts has expanded to 3.58 million barrels per week (0.511 million bopd).
Even more telling, in the five years prior to June 30th, 2016, consensus forecasts had never differed from reported weekly inventory changes by more than ten million barrels and erred by more than eight million barrels on only four occasions.
Since June 30th, 2016 (51 weekly periods), consensus forecasts differed from the reported inventory change by more than eight million barrels on four occasions and have missed by more than ten million barrels on three occasions! That’s HUGE!
In fact, the three largest forecast ‘misses’ (the absolute forecast error) happened on September 2nd, 2016 (15.42 million barrels), October 28th, 2016 (12.42 million barrels) and February 3rd, 2017 (11.33 million barrels).
Have a look at this chart and guess what it is…don’t peek at the answer below. The only hint is…it relates to the increasing unpredictability of weekly crude oil inventory data:
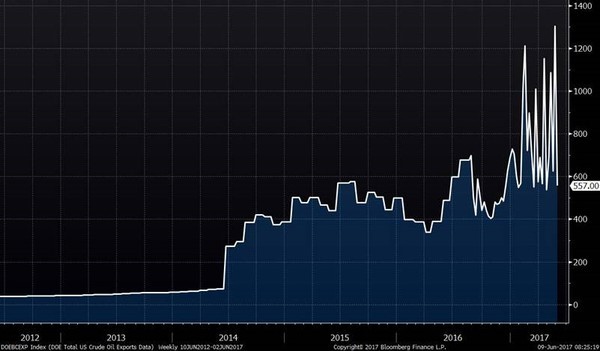
Give up? US oil exports. On December 18th, 2015, Congress passed and the President signed legislation repealing the decades-old ban on U.S. crude oil exports.
Prior to the resumption of seaborne exports, weekly U.S. crude export estimates were unchanged most weeks – averaging 0.495 million bopd in 2015 (mostly flows to Canada to be re-imported as diluent), with the EIA making small adjustments (+/- 50,000 to 100,000 bopd) to their weekly export estimates every three or four weeks.
At the time, the largest one week change in estimated exports on record was +0.199 million bopd (June 20th, 2014). By mid-2016, seaborne crude exports became meaningful, increasing the volatility of exports—by a WIDE margin.
As the above chart shows, over the past six months the volatility has exploded – perhaps best demonstrated by the swing estimated U.S. crude oil exports from 9.12 million barrels two weeks ago (1.30 million bopd) to just 3.90 million barrels (0.56 million bopd) in EIA estimates released this week – a 5.22 million barrel decline (0.746 million bopd)!
I pay my researchers a lot of money, but even they couldn’t figure out a relationship between these datasets and the weekly exports reported by the EIA.
Several services try to tackle the export data issue (Genscape and Clipperdata, for example) – with new services seemingly being launched monthly – but my researchers have yet to find a useful dataset (to date, they tell me that the best predictor of weekly exports is a mean reversion model).
In the meantime, the situation will only get worse: US crude oil exports have increased from an average of 0.485 million bopd in 2016 to an average of 0.886 million bopd over the past four weeks and exporters are pushing to use increasingly larger vessels – making the timing of individual loadings increasingly impactful.
What I think is happening is that the EIA is (somewhat mistakenly) taking every increase in storage to be a drop in demand, when it may really be just a lumpy export dataset. At 2 million barrels per VLCC, one ship leaving port a day late can skew EIA weekly data by a lot.
If this is correct…and I don’t know for sure that it is…that would mean that at some point, the EIA will have to correct/revise their data—to the downside, which is bullish.
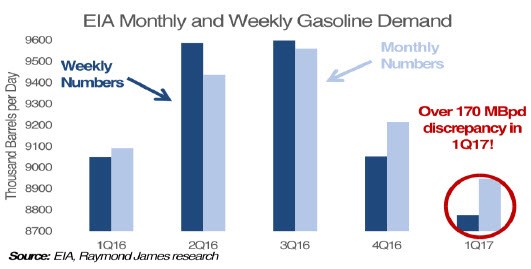
Obviously, I am not the only one noticing this. US brokerage firm Raymond James had some excellent statistics and charts in their weekly Energy Stat on Monday July 19 basically making the same case, with four key points:
1. Monthly EIA demand numbers, which are more accurate than weekly, show a 170,000 bopd discrepancy in Q1 2017–HUGE!
2. PADD 3 demand data (this is where the Gulf Coast is; where most of the 2 million barrel VLCCs come and go from) is down an impossible 15% YoY.
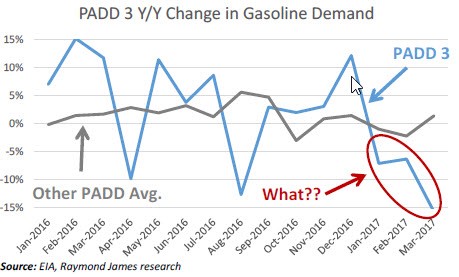
3. Demand is not down at all–it’s up 1.6% in PADD 3, says EIA data
4. Mileage data is within 0.1 MPG in the last 3 years, so it’s not cars being more efficient
The EIA is very open about the challenges of measuring demand; in no way is anyone chiding them. They have a very hard job–that was just made a lot harder by a massive increase in crude oil export activity–and volatility.

 VS. TECHNICALS (GOOD)")


